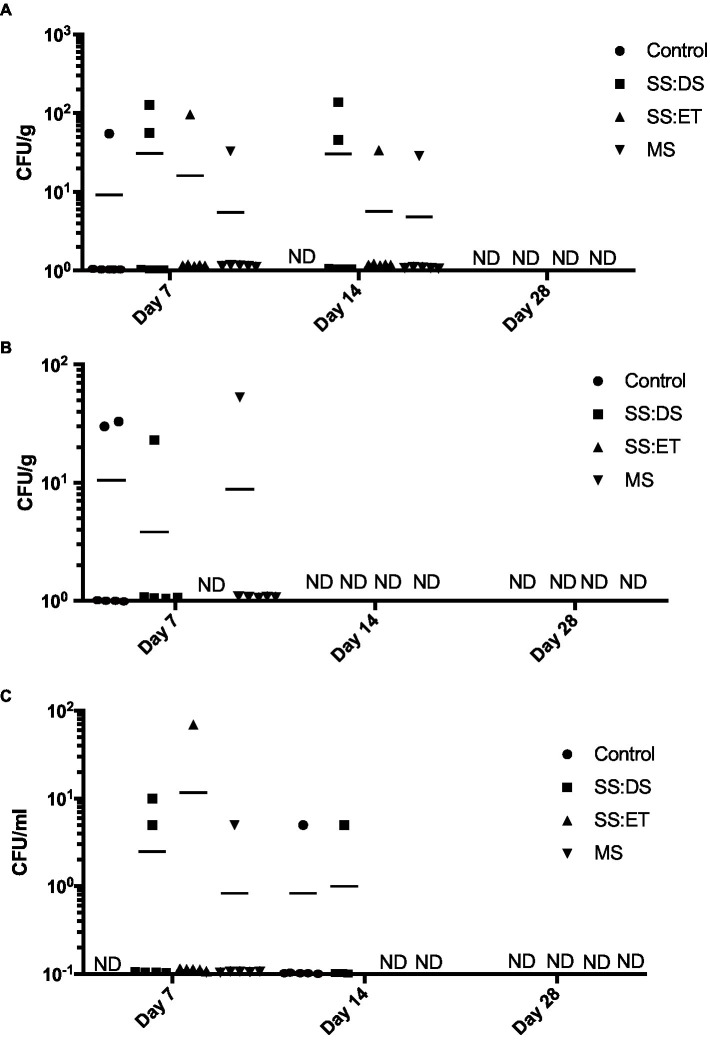
Figure 2.
Vibrio parahaemolyticus recovered from oyster tissue. Vibrio parahaemolyticus numbers in adductor muscle (A), gill (B), and hemolymph (C) at days 7, 14, and 28 post-tank inoculation with 104 CFU/mL of V. parahaemolyticus in each of the treatment groups, which consisted of the control, single stress: decreased saline (SS:DS), single stress: elevated temperature (SS:ET), and multistress: decreased saline and increased temperature (MS). Significant differences in bacterial burdens between treatment groups were assessed by analyzing rank-transformed culturable bacterial data by two-way ANOVA using Tukey’s post-test for multiple comparisons. Each data point represents results from one oyster. Data points located on the horizontal axis indicate values were below the limit of detection. Horizontal lines represent mean values of six oysters at days 7 and 14, and five to six oysters at day 28. ND, not detected.

