FIGURE 3.
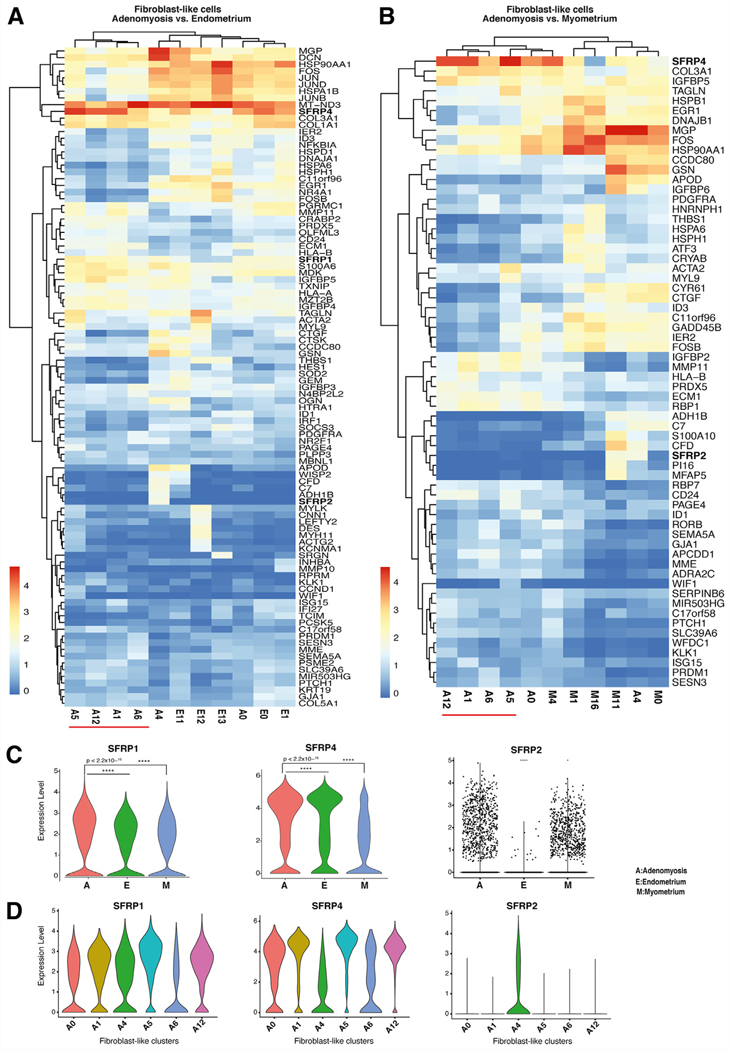
Comparative analysis of differential gene expression in fibroblast populations across the 3 tissue types. (A) Heatmap of highly expressed genes in fibroblast-like cell populations in adenomyosis versus endometrium. The adenomyotic fibroblasts population A0 clustered together with the endometrial fibroblast types, suggesting that it may be of endometrial origin. (B) Heatmap of highly expressed genes in fibroblast-like cell populations in adenomyosis versus myometrium. The adenomyotic fibroblast-like population A4 clustered together with the myometrial fibroblast populations, suggesting that A4 might originate from myometrial tissue. (C) Violin plots displaying statistically significant differential expression of SFRPs (SFRP1, SFRP4, SFRP2) between the fibroblast-like clusters of adenomyosis (A), endometrium (E), and myometrium (M). (D) Violin plots displaying statistically significant differential gene expression of SFRPs (SFRP1, SFRP4, SFRP2) between selected fibroblast-like clusters in adenomyosis.

