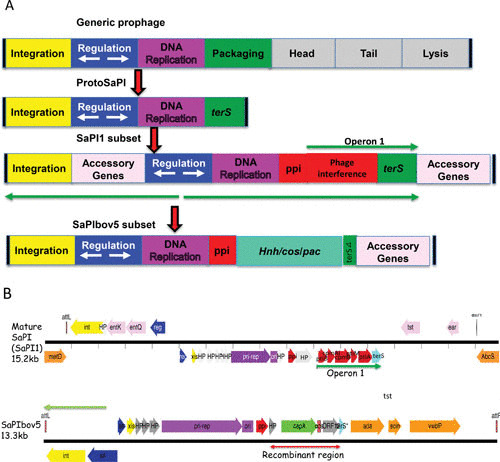
FIGURE 1.

The SaPI genome and its putative origin. (A) Block diagrams. At the top is a typical prophage genome, and below that is the putative SaPI precursor, presumably the result of a major deletion. Next are two extant SaPI genomes. (B) Genetic maps of SaPI1 and SaPIbov5. Colors: red, interference genes; aqua, terS; orange, accessory genes; blue, regulatory genes; yellow, int/xis; gray, hypotheticals; purple, replication.
