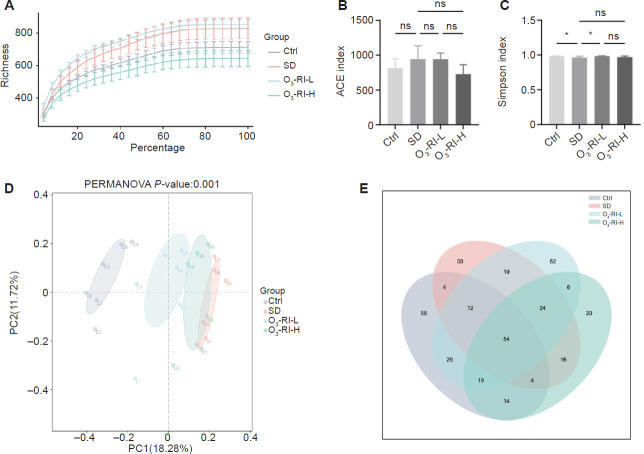
Figure 4.
O3-RI affects the gut microbiota diversity in SD mice.
Note: (A) Rarefaction curves. (B) Simpson index. (C) ACE index. Data are expressed as mean ± SD (n = 6). *P < 0.05 (one-way analysis of variance, followed by Tukey's multiple comparison test). (D) Principal coordinates analysis analysis. (E) Venn of similarity and overlap of operational taxonomic unit number in each group. ACE: Abundance-based coverage estimator; Ctrl: control; ns: no significance; O3-RI: ozone rectal insufflation; O3-RI-H: high-concentration O3-RI; O3-RI-L: low-concentration O3-RI; SD: sleep deprivation.

