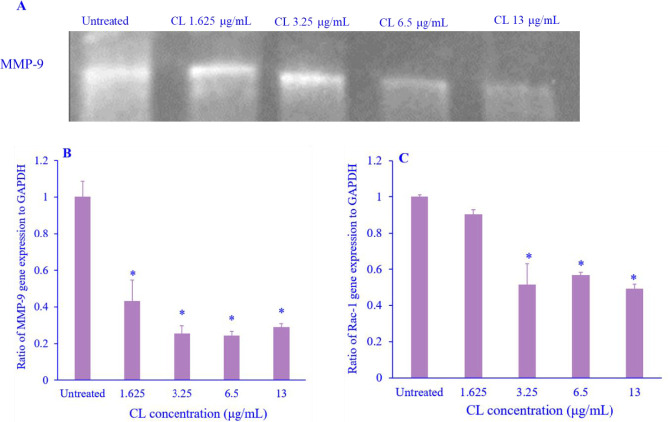
Fig. 4.
The activity of MMP-9 and the expression of Rac-1 after CL treatment on MDAMB-231 breast cancer cells. (A) The MMP activity of MMP-9 was visualized as a clear band against the dark blue background of the gelatine substrate in the gel. Molecular weight markers were used to estimate the molecular masses of the pro and active forms of MMP-9. Blots were scanned and intensities of the bands were measured by ImageJ software, normalized with untreated, and plotted; (B) percentage gene expression of MMP-9 activity was measured by qRT-PCR, and (C) Percentage of Rac-1 gene expression level of cell migration-related proteins was measured by qRT-PCR. Data are presented as mean + SEM, N = 3. *P < 0.05 Indicates significant differences in comparison with the untreated cells. CL, Curcuma longa; MMP-9, matrix metalloproteinase-9; Rac-1, Ras-related C3 botulinum toxin substrate 1; qRT-PCR, quantitative real-time polymerase chain reaction.

