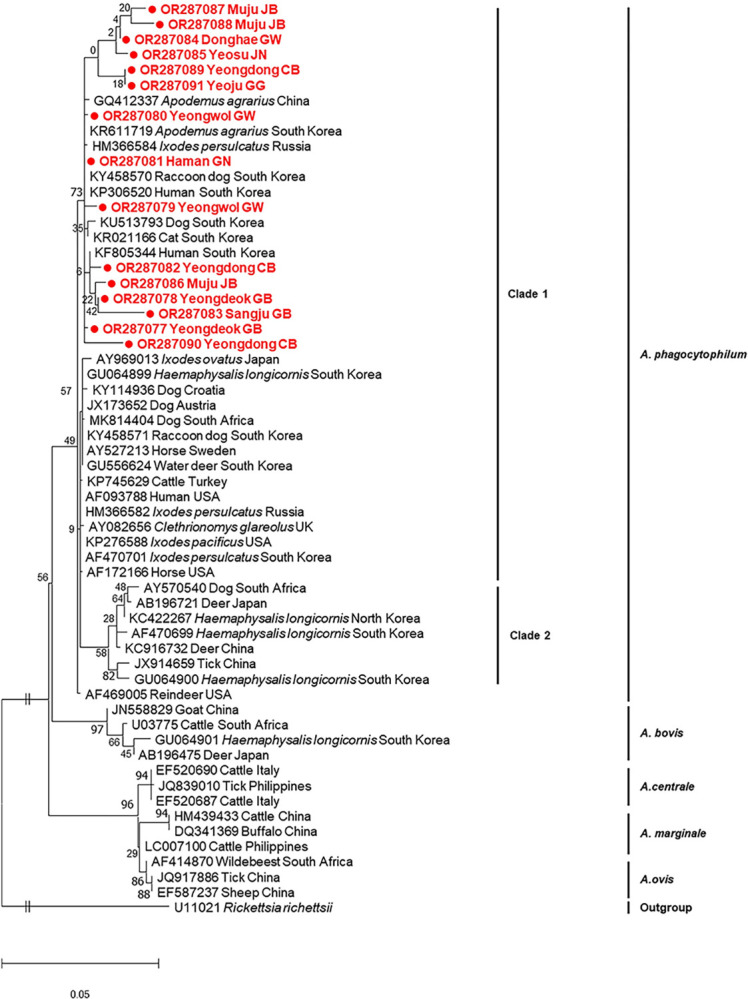
Fig 2. Phylogenetic tree inferred by maximum-likelihood analysis using the K2 + G model of the 16S rRNA gene sequence of Anaplasma phagocytophilum.

The numbers at the nodes are bootstrap values expressed as a percentage of 1,000 replicates. The scale bar indicates nucleotide substitution per site. Samples sequenced from Apodemus agrarius are shown in filled circles.
