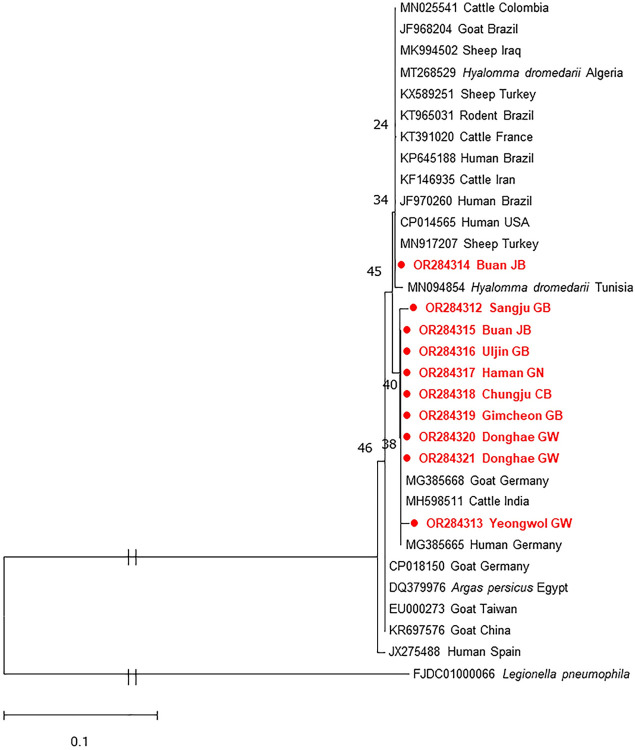
Fig 5. Maximum-likelihood phylogenetic tree from the IS1111 gene of Coxiella burnetii.
The evolutionary analysis was inferred using the Kimura 2-parameter model. Bootstrap values (1,000 replicates) are indicated in each node. The scale bar indicates nucleotide substitution per site. Sequences determined from A. agrarius are highlighted in filled circles.

