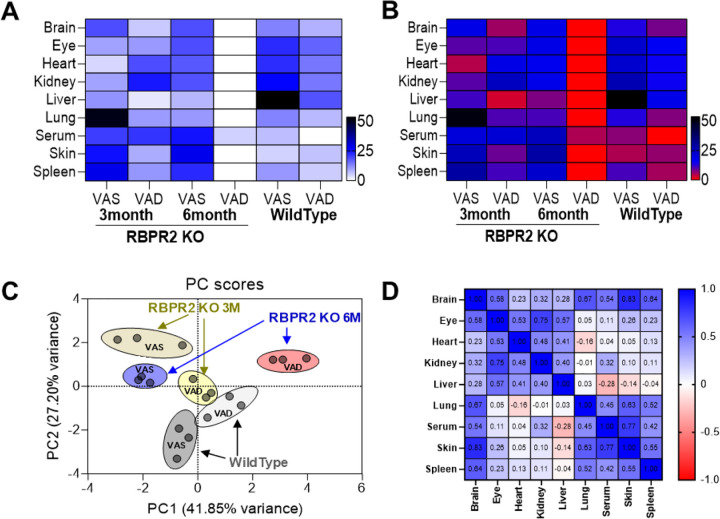
Figure 3: All-trans ROL distribution in ocular and non-ocular tissues of WT and Rbpr2−/− mice on VAS or VAD diets.
(A) Heat map of all-trans ROL levels in WT and Rbpr2−/− mice at 3- and 6-months of age, in various tissues. (B, C) data clustering and variance by Principal Component Analysis (PCA). (D) Correlation matrix showing the all-trans ROL distribution pattern in tissue samples. VAS, vitamin A sufficient diet; VAD, vitamin A deficient diet; WT, wild-type mice.

