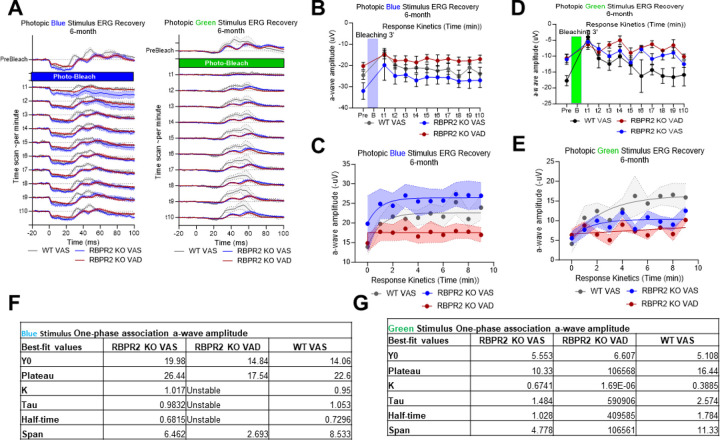
Figure 9: Short wavelength cone opsin Opn1sw physiological kinetics assessment by ERG photobleach recovery response.
(A-E) time series of ERG response in pre-bleaching, bleaching with full intensity blue and green stimulant light and recovery response showing the kinetics curve in WT and Rbpr2−/− mice fed with either a VAS or VAD diet at 6-months of age. (F, G) One-phase association of a-wave amplitude and b-wave amplitude showing the stability and half-life of cone opsin response recovery.

