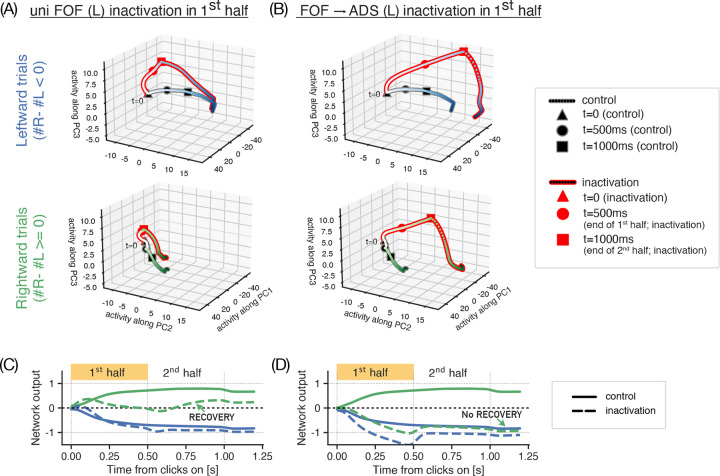
Figure 5. Network activity and outputs during nonselective FOF inactivations reveal recovery dynamics.
Low-dimensional projections of network activity trajectories (A,B) and network outputs (C,D) during unilateral (uni; here left hemisphere) inactivations of FOF (A,C) and inactivations of its projections to left ADS (B,D) in the 1st half of the stimulus period. (A-B) Neural activity on leftward (top) and rightward (bottom) trials show that inactivation trajectories (lines with red edges, red boxes) diverge from control ones (lines/boxes with grey edges) for both experiments in the first half (until circle markers). However in the second half (from circle to square markers), these recover towards control trajectories during unilateral FOF inactivations (A), but not during FOF→ADS inactivations (B) driving leftward (or ipsilaterally biased) choices. The effect is more prominent in rightward trials (lower panels) (C-D) A similar pattern is seen in the network outputs on rightward trials (green lines in C,D), where for both experiments, outputs upon inactivation (dashed) diverge from control (solid) in the first half, recovering and driving correct choices during FOF inactivations (C) but not during FOF→ADS inactivations (D).

