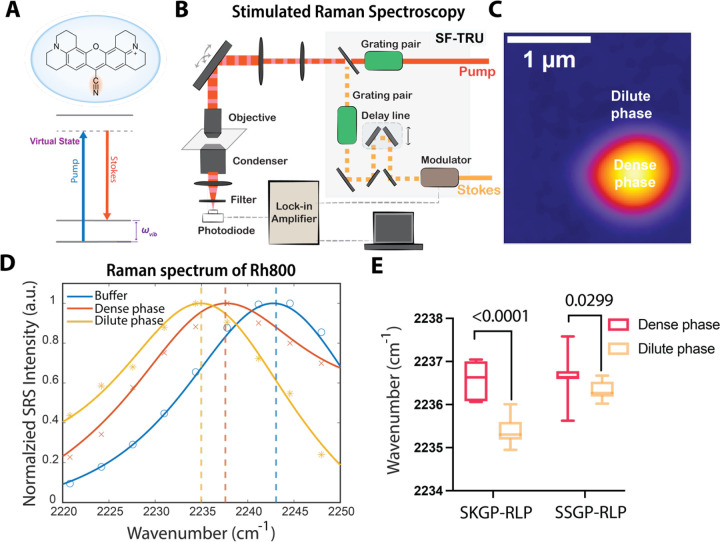
Figure 4. Characterization of water environments using hyperspectral stimulated Raman Spectroscopy.
A, Chemical structure of nitrile bearing Rh800 and the energy diagram of the stimulated Raman process.
B, Microscope setup for stimulated Raman imaging with Rh800 probe for condensate samples.
C, A representative image showing the fluorescence signal of Rh800 in a condensate with spatially defined dense and dilute phases.
D, Normalized SRS spectrums of condensate buffer (50 mM Tris, 150 mM NaCl), the dilute phase and the dense phase of condensates formed by RLPWT.
E, Comparison of SRS peak frequency of C≡N of Rh800 evaluated for the dilute and the dense phases of condensates formed by different sequences. Unpaired T-test shows the p-value.

