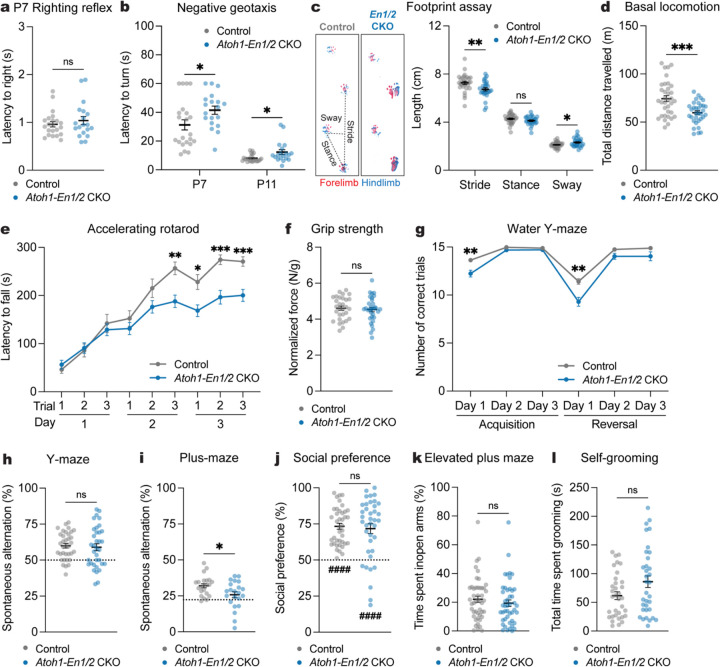
Fig. 6 |. Loss of En1/2 in all eCN impairs motor coordination and learning, cognitive flexibility, and spatial working memory.
a, Latency to right onto four paws at P7 (Atoh1-En1/2 CKOs: n=19, littermate controls: n=22; Mann-Whitney U test: U = 192.5, P = 0.6741).
b, Latency to turn upward on a negative slope at P7 and P11 (Atoh1-En1/2 CKOs: n=19, littermate controls: n=22). Multiple Mann-Whitney U tests with Holm-Šídák correction for effect of genotype at P7 (U = 128, P = 0.0245) and P11 (U = 114.5, P = 0.033).
c, (left) Representative images of footprints from an Atoh1-En1/2 CKO and littermate control. (right) Quantification of stride, stance, and sway (Atoh1-En1/2 CKOs: n=28, littermate controls: n=30). Multiple Mann-Whitney U tests for effect of genotype on stride (U = 237, P = 0.0039) and sway (U = 292.5, P = 0.047), but not stance (U = 312, P = 0.0936).
d, Total distance travelled during basal locomotion (Atoh1-En1/2 CKOs: n=33, littermate controls: n=35; two-tailed unpaired t-test: t66 = 3.931, P = 0.0002).
e, Latency to fall in the accelerating rotarod test (Atoh1-En1/2 CKOs: n=32, littermate controls: n=30). Repeated measure two-way ANOVA: main effect of time (F5.648,338.9 = 90.56, P < 0.0001), genotype (F1,60 = 7.791, P = 0.0070), and interaction (F8,480 = 5.827, P < 0.0001); with post hoc two-tailed t-tests with Šídák correction for effect of genotype on day 2-trial 3 (t59.83 = 3.721, P = 0.0040), day 3-trial 1 (t55.69 = 3.019, P = 0.0338), day 3-trial 2 (t55.46 = 4.502, P = 0.0003), day 3-trial 3 (t57.98 = 4.416, P = 0.0004), and other comparisons (P ≥ 0.05).
f, Forelimb grip strength normalized to body weight (Atoh1-En1/2 CKOs: n=32, littermate controls: n=30; two-tailed unpaired t-test: t60 = 0.4298, P = 0.6689).
g, Total number of correct trials during the water Y-maze test (Atoh1-En1/2 CKOs: n=31, littermate controls: n=35). Repeated measure two-way ANOVA: main effect of time (F3.003,192.2 = 118.4, P < 0.0001), genotype (F1,64 = 21.47, P < 0.0001), and interaction (F5,320 = 5.101, P = 0.0002); with post hoc two-tailed t-tests with Šídák correction for effect of genotype on Acquisition Day 1 (t42.50 = 3.583, P = 0.0052), Reversal Day 1 (t52.14 = 3.821, P = 0.0021), and no other comparisons (P ≥ 0.05).
h, Percentage of spontaneous alternations in the Y-maze (n=35 per genotype; two-tailed unpaired t-test: t68 = 0.3622, P = 0.7183). Chance level performance is 50% (dotted line).
i, Percentage of spontaneous alternations in the plus-maze (n=22 per genotype; two-tailed unpaired t-test: t42 = 2.486, P = 0.0170). Chance level performance is 22.2% (dotted line).
j, Social preference (percent time nose spent within novel mouse contact zone) during the three-chamber social approach test (Atoh1-En1/2 CKOs: n=38, littermate controls: n=40; Mann-Whitney U test: U = 723, P = 0.7167). Wilcoxon test against a null hypothesis (50%) in Atoh1-En1/2 CKOs (W = 605, P < 0.0001) and littermate controls (W = 820, P < 0.0001).
k, Percentage of time spent in the open arms of an elevated plus maze (Atoh1-En1/2 CKOs: n=46, littermate control: n=47; Mann-Whitney U test: U = 923, P = 0.2266).
j, Total time spent self-grooming (n=34 per genotype; Mann-Whitney U test: U = 455, P = 0.1336).
ns, not significant: P ≥ 0.05. Data are presented as mean values ± SEM.

