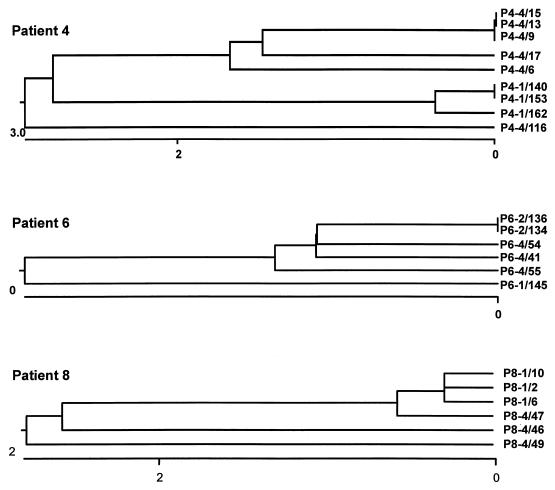
FIG. 1.
Phylogenetic relationships among env clones from patients 4, 6, and 8. The clones are designated P#-N/nn, where # indicates the patient number, N indicates the semiannual visit number, and nn indicates the clone number. The clones sequenced and their GenBank accession numbers are listed in the text. The results of analyses of the clones from patients 4, 6, and 8 are shown. The regions sequenced are described in the text. The graphs below each dendrogram indicate the percentage of divergence. Sequences were assembled and analyzed by CLUSTAL analysis with the program DNAstar (7).

