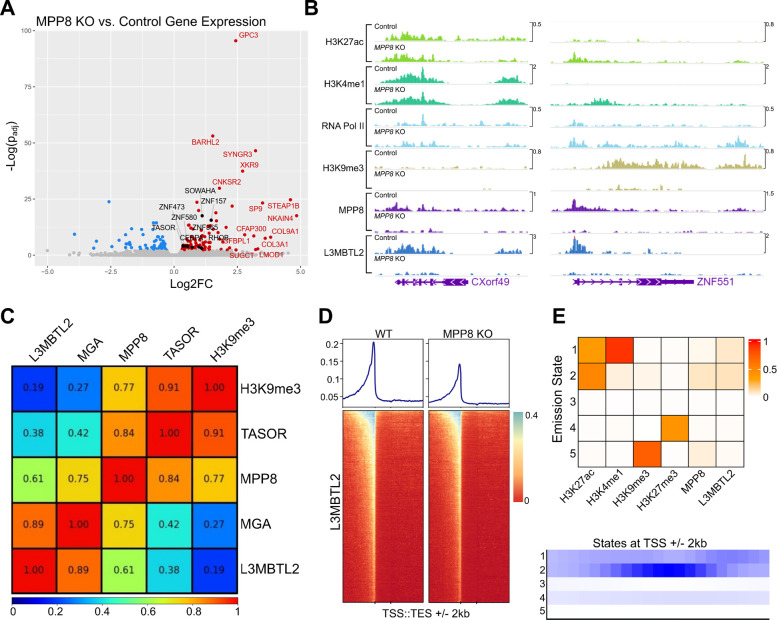
Figure 3: Genome-wide characterization of loci bound by PRC1.6 and HUSH in Jurkat cells.
(A) Total RNA sequencing of Jurkat cells harboring L3MBTL2 knockout versus control Jurkat cells. Colored/labeled points meet significance thresholds (FDR 0.1). (B) Normalized (counts-per-million) CUT&Tag signal targeting named factors at CXorf49 and ZNF551 loci in unmodified Jurkat cells (Control) and MPP8 knockout Jurkat cells (MPP8 KO). (C) Pearson correlation of counts-per-million-normalized CUT&Tag signal of named factors at annotated human genes (hg38 RefSeq transcription start to end site). (D) L3MBTL2 CUT&Tag coverage map at human genes; transcription start site (TSS) to transcription end site (TES) regions are scaled by length. 2 kilobases upstream and downstream of scaled regions are also depicted. (E) ChromHMM [40] emission states using CUT&Tag from named factors as input (top panel). Coverage of each emission state with respect to transcription start sites (TSSs). For data associated with this figure please see Extended Data Tables 7 and 8 and SRA Bioproject PRJNA869850.

