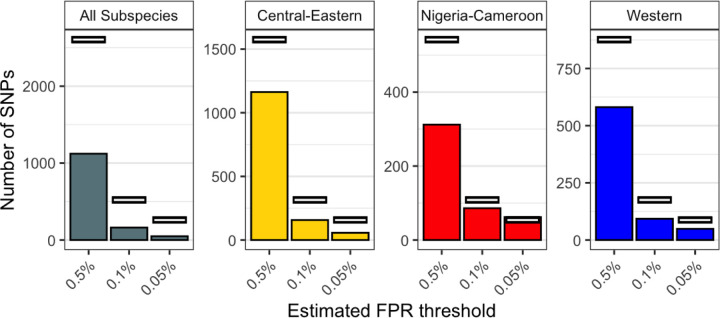
Fig. 2. Number of genetics-only candidate SNPs.
The number of candidate SNPs from the genetics-only test (bars) compared to the null expectation (white lines) at XtX* thresholds corresponding to estimated FPRs of 0.5%, 0.1% and 0.05%, for each subspecies-dataset. Note that y-axis scales are not consistent across panels.

