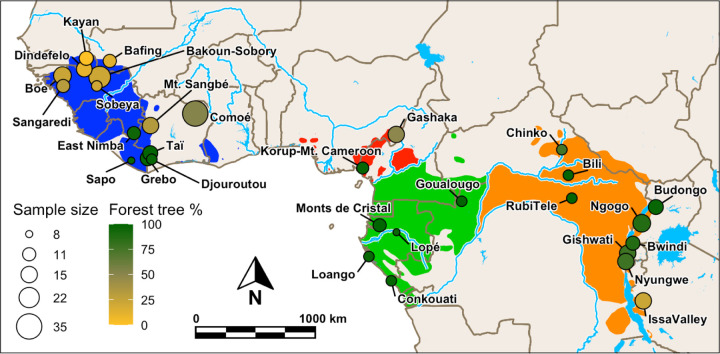
Fig. 3. BayPass analysis dataset.
Map of West, Central and East Africa showing the location, sample size (after filtering) and forest-tree-percentage for each population in the BayPass analyses. The ranges of the four subspecies are shown (green=central, orange=eastern, red=Nigeria-Cameroon, blue=western) (1) with major rivers and lakes indicated in light blue.

