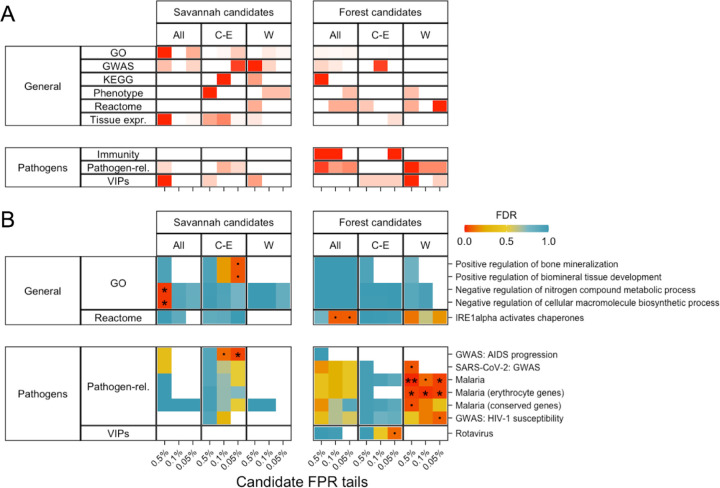
Fig. 5. GEA candidate gene set enrichment results.
Results for 0.5%, 0.1% and 0.05% FPR tails for savannah and forest candidate SNPs are shown. Vertical panels indicate results from each subspecies-dataset. Horizontal panels show the broad categories that the gene sets belong to. Multiple testing correction was done within each gene set enrichment analysis run (i.e., each tail and gene set database such as ‘Pathogen-related’, ‘GWAS’, ‘Phenotype’ etc.). (A) the number of gene sets with FDR<0.5, cells are coloured in a gradient from white (0) to red (the largest value per row) (Fig. S50 shows the numbers in each cell). (B) shows the FDR values for the most enriched gene sets with FDR<0.1 for at least one candidate tail in at least one subspecies-dataset (‘.’ FDR<0.1, ‘*’ FDR<0.05, ‘**’ FDR<0.01).

