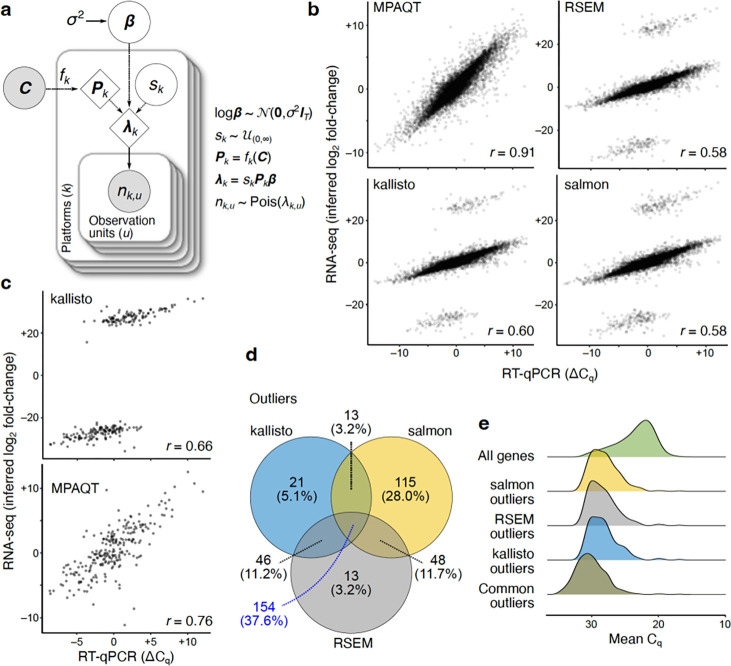
Figure 1.
Overview of MPAQT and its performance for inference of gene-level abundances. (a) The generative model of MPAQT. Open circles, closed circles, and the diamonds represent latent variables, observed variables, and deterministic computations, respectively. : vector of transcript abundances; : library size for platform : set of transcript sequences; : number of reads mapping to the observation unit in platform . See Methods for description of other variables. (b) Inferred log fold-change between MAQCA and MAQCB, calculated from TPM predictions by MPAQT, RSEM, kallisto, and salmon, plotted against the ground truth qPCR difference. Each point is one gene . (c) Top: kallisto’s outliers, isolated from other genes. Bottom: MPAQT’s inferences for kallisto’s outlier genes . (d) Venn diagram showing overlap of outliers among kallisto, salmon, and RSEM. (e) Density curves of mean of MAQCA and MAQCB Cq-values for each tool’s outliers and for all genes. For benchmarking results with the expanded filtering range, see Supplementary Figure 2. Data underlying this figure can be found in Supplementary Data Table 1.

