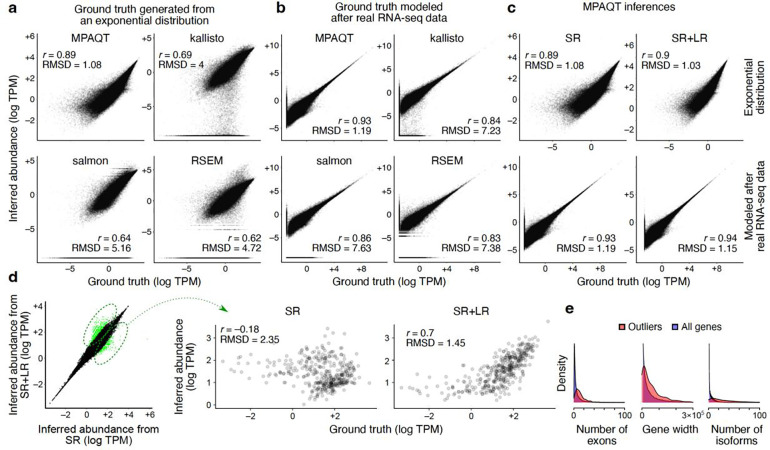
Figure 2.
Accurate inference of transcript abundances using MPAQT. (a) Benchmarking of MPAQT and three other tools using simulated SR data with ground-truth TPMs generated from an exponential distribution. (b) Similar to (a), but for a simulated sample with ground-truth TPM values modeled after real data (see Methods for details). (c) Performance of MPAQT using SR data alone (left) or SR+LR data (right), on simulated data generated from ground truth TPMs with an exponential distribution (top) or modeled after real RNA-seq data (bottom). SR plots are identical to the top-left plots in panels (a) and (b) and are repeated here for easier comparison to SR+LR. (d) Left: Comparison of SR vs. SR+LR inferences for one dataset simulated from an exponential distribution (see Supplementary Figure 3 for more simulation repeats). Transcripts with substantially different inferences are highlighted (outlier analysis based on Mahalanobis distance >6.36, equivalent to upper-tail P<10−10 for normally distributed data). Right: Comparison of inferred vs. ground truth TPMs for transcripts that are significantly differentially quantified (i.e., transcripts highlighted in the left panel). (e) Distributions of number of exons, gene width, and number of isoforms for genes encoding the transcripts that are differentially quantified between SR and SR+LR analyses. The distributions for all genes are also shown, for comparison.

