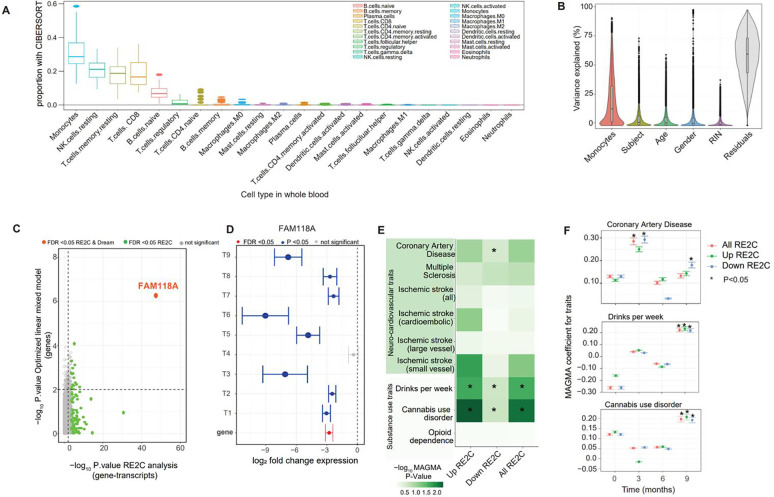
Figure 2.
A). Cell deconvolution analysis conducted with CIBERSORT demonstrates the cell types identified from whole blood, and box plots showing the cell type proportions in the study samples. The greatest gene expression variability and highest proportion is in monocytes. B).Variance partition plots demonstrate additional sources of gene expression variability that are covariates for the generalized linear model. C-D). Plots of high vs. intermediate days of abstinence from multivariate analysis with RE2C and concordance analysis of significant gene-transcript (i.e., transcripts T1-T9) associations at 9 months demonstrate dysregulation of FAM118A expression. E-F). GWAS enrichment (MAGMA) analysis of significant transcripts shows genetic predisposition toward some substance use traits (“drinks per week” and cannabis use disorder) and coronary artery disease. Significance determined based on nominal P-value and FDR<0.05 thresholds.

