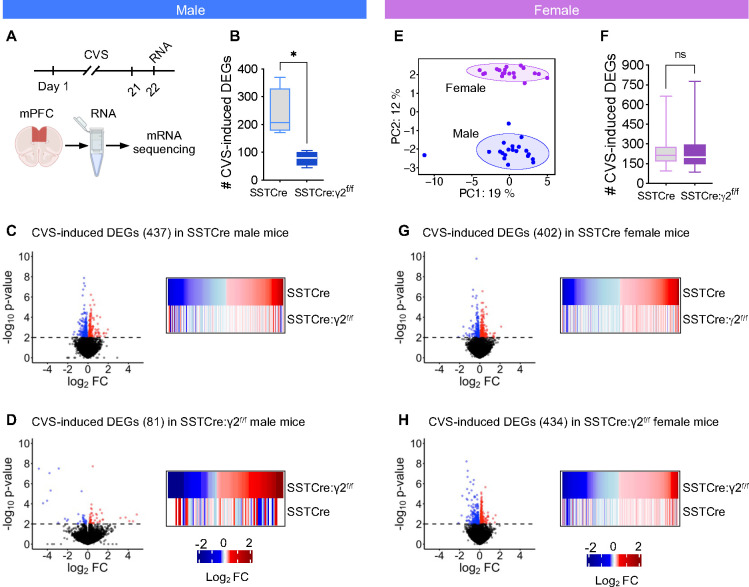
Figure 2. CVS-induced DEGs in the mPFC of SSTCre:γ2f/f stress resilient male mice are fewer and distinct from those of SSTCre controls.
A) Experimental design. B) The average number of CVS induced DEGs (p < 0.01) determined from subsamples of mice revealed fewer CVS-induced DEGs in SSTCre:γ2f/f vs. SSTCre mice (p = 0.013, n = 4, t-test) C) Volcano plot of CVS induced DEGs (p < 0.01) in mPFC of SSTCre male mice (n = 5–6), along with heat map comparing the CVS-induced transcriptional changes of DEGs in SSTCre controls (log2FC, top) to those of SSTCre:γ2f/f mice. Blue and red dots and lines indicate downregulated and upregulated genes, p value cutoff, respectively. Note that the CVS-induced DEGs of SSTCre mice were randomly affected by CVS in SSTCre:γ2f/f mice. D) Volcano plot of CVS induced DEGs (p < 0.01) in SSTCre:γ2f/f males (n = 3–4) along with heat maps comparing transcriptional changes of CVS exposed SSTCre:γ2f/f male mice to those of SSTCre controls. Again, CVS-induced DEGs observed in SSTCre:γ2f/f mice were randomly affected by CVS in SSTCre mice. E) PCA analysis revealed clear separation of male and female samples after batch normalization and two outliers among male samples were removed in all analyses. Circles indicate 95% CI. F–H) Analyses of female mice analogous to males. The number of CVS-induced DEGs in female mice (p < 0.01) in SSTCre and SSTCre:γ2f/f mice analyzed by subsampling of mice was unaffected by genotype (n = 100, Welch’s t-test) (F). CVS-induced DEGs in the mPFC of female SSTCre mice show comparable directional changes of expression in SSTCre:γ2f/f mice (n = 5) (G) and the CVS-induced DEGs in SSTCre:γ2f/f mice are similarly affected by CVS in SSTCre controls (H).

