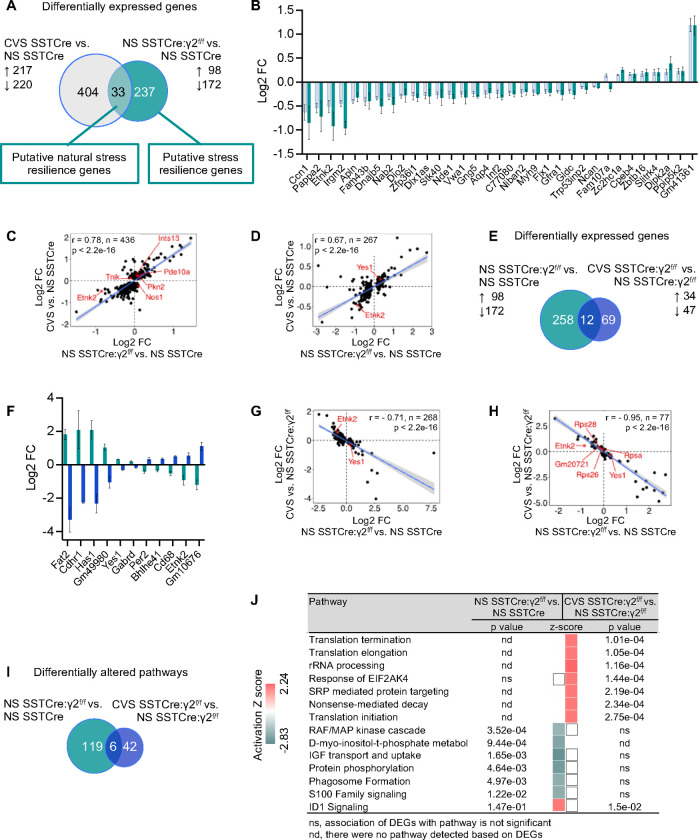
Figure 4. NS stress-resilient male mice mimic transcriptome changes of CVS-exposed stress vulnerable mice, and they are reversed by CVS exposure.
A) Venn diagram comparing CVS-induced DEGs in SSTCre mice with genotype induced DEGs in NS SSTCre:γ2f/f vs. NS SSTCre mice. B) Log2 FC of 33 DEGs that overlap in (A). C, D) Correlation of Log2 FC between CVS-induced DEGs in SSTCre mice and genotype-induced changes in expression of the same genes in NS SSTCre:γ2f/f vs. NS SSTCre mice (C), and between genotype-induced DEGs (NS SSTCre:γ2f/f vs. NS SSTCre mice) and CVS-induced changes of the same genes in SSTCre mice (D). Note the high level of correlation of FCs in both contrasts. E) Venn diagram comparing genotype induced DEGs in NS SSTCre:γ2f/f vs. NS SSTCre mice with CVS-induced DEGs in SSTCre:γ2f/f mice. F) Log2 FC of the 12 DEGs that overlap in (E). Note that the genotype induced gene expression change of each is opposite to the CVS effect in the stress resilient mutants. G, H) Correlational analyses of Log2 FC of genotype induced DEGs (NS SSTCre:γ2f/f vs. NS SSTCre mice) with CVS-induced changes of the same genes in SSTCre:γ2f/f mice (G) and Log2 FC of CVS-induced DEGs in SSTCre:γ2f/f mice with genotype-induced changes in expression of the same genes in NS SSTCre:γ2f/f vs. NS SSTCre mice (H). Note the strong anticorrelation of FCs between these two contrasts. I) Venn diagram of IPA pathways (p < 0.05) induced by CVS in stress-resilient mice compared to pathways induced by genotype (NS SSTCre:γ2f/f vs. NS SSTCre mice). J) The top seven pathways are activated selectively by CVS in stress-resilient mice as in Figure 3F. Six of the next seven pathways are selectively inhibited in NS stress-resilient mice. White squares indicate pathways that were detected but a directional Z-score could not be determined. ns, not significant; nd, not detected.

