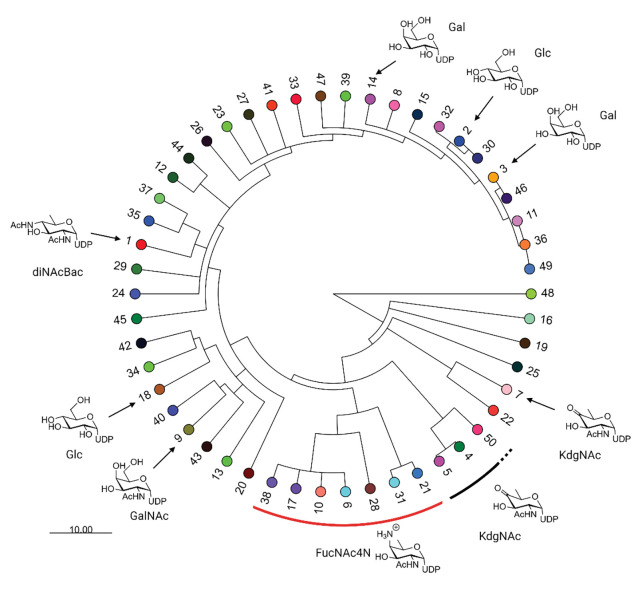
Figure 3:
The SSN Dendrogram with leaf nodes that represent clusters in network E-71. The labeling indicates cluster number by descending node count and leaf node coloring is consistent with Fig 2. Putative and verified substrate assignments are indicated with symbols pointing to the appropriate cluster. Scale represents size of E-value change encoded in branching point length.

