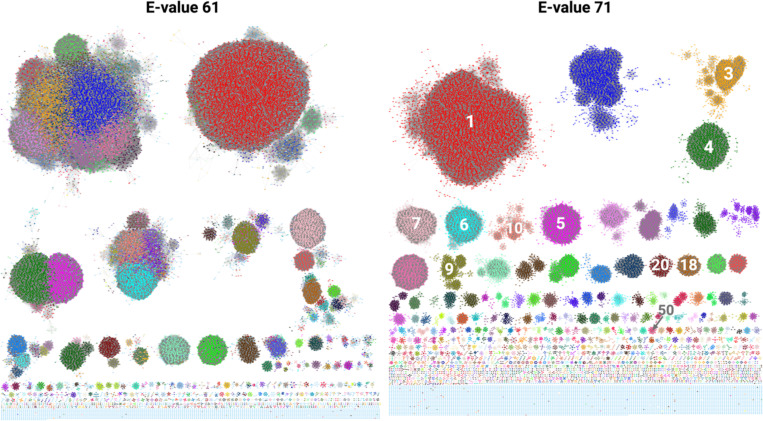
Figure 2:
SSNs as selected by Closeness Analysis. Each colored node represents a SmPGT sequence or group of 100% identical SmPGT sequences (100% representative node, repnode). E-61 network colored according to the EFI-EST-applied coloring of network E-71 (descending in order of cluster size, red largest, blue second largest…) to show originating clusters. E-71 The cluster numbers of expressed PGTs (Table 1) are labeled.

