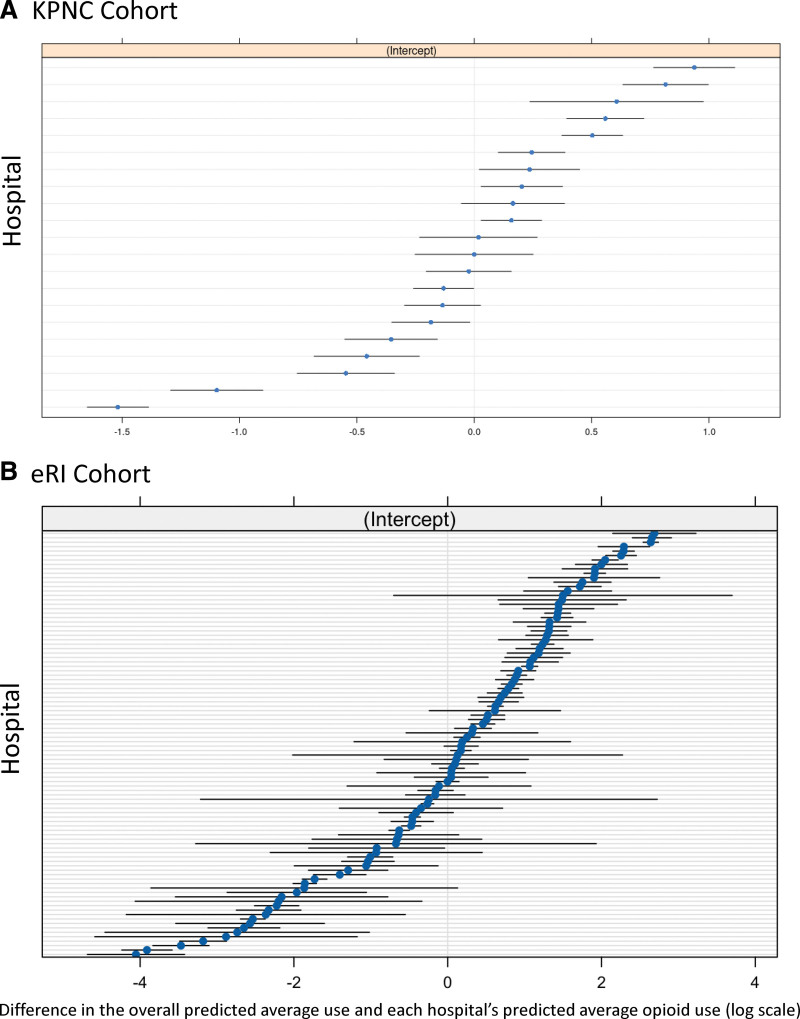
Figure 1.
Opioid use by hospital. Shown are the difference between the overall predicted average use of opioid infusions on the log scale (centered at 0) for the cohort and each hospital’s predicted average use of opioid infusions (blue dots) and 95% CIs (black band) for Kaiser Permanente Northern California (KPNC) (A) and Philips electronic ICU Research Institute (eRI) (B).

