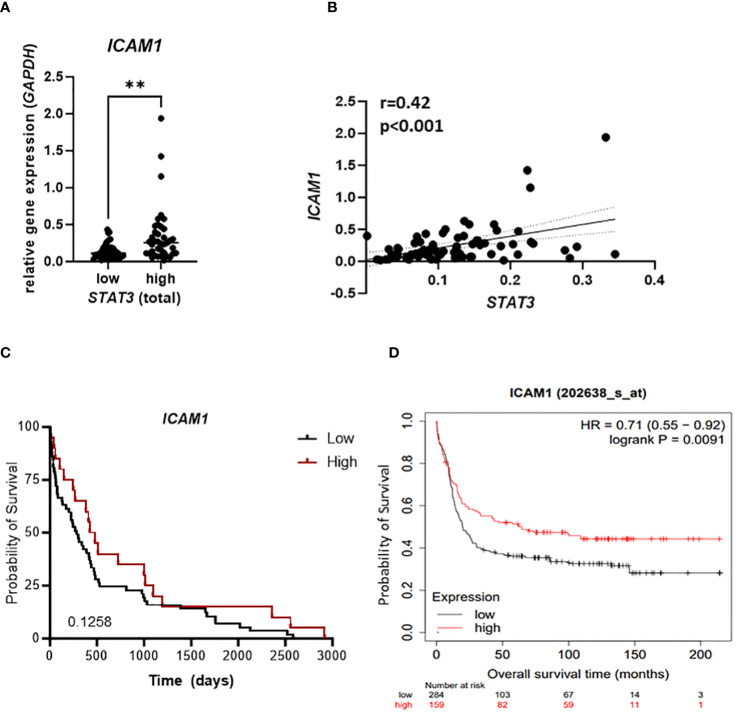
Figure 6.
STAT3 correlates with ICAM1 expression in AML patient samples. (A–C) 79 AML patient samples were analyzed for expression of STAT3 and ICAM1 using RT-qPCR and (A) ICAM1 expression was compared between STAT3 high and STAT3 low group. Statistical analysis was performed using unpaired t-test; **p < 0.01. (B) The correlation between STAT3 and ICAM1 expression was analyzed using Pearson test. (C) Kaplan-Meier plot shows the probability of survival of AML patients expressing high or low ICAM1. (D) Kaplan Meier plot shows the probability of survival of AML patients from publicly available datasets (kmplot.com) stratified into ICAM1 high and low groups. (C, D) Statistical analysis was performed using log-rank (Mantel-Cox) test.

