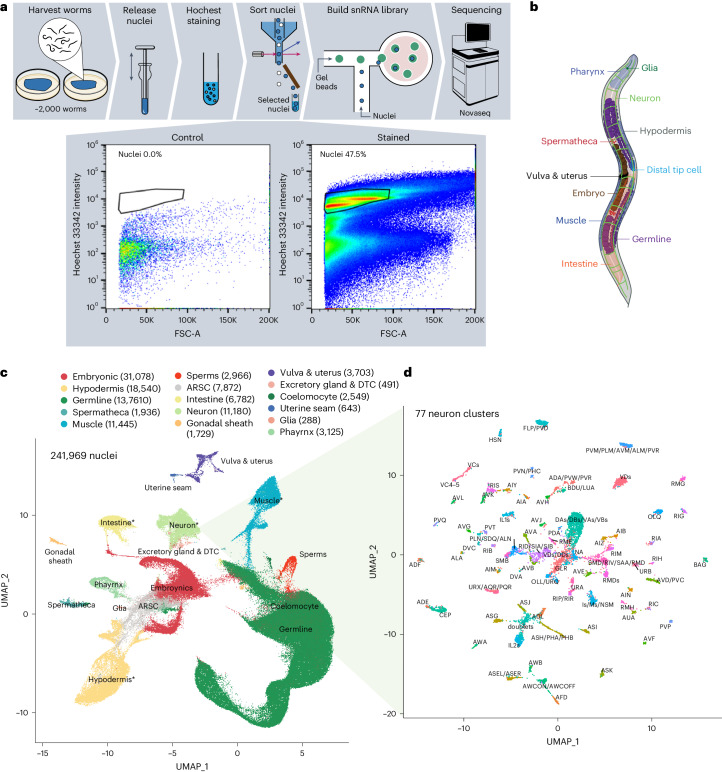
Fig. 1. Adult C. elegans cell atlas at single-cell resolution.
a, Schematics of single-cell transcriptome profiling pipeline in adult C. elegans. The process begins with harvesting and homogenizing approximately 2,000 worms to isolate nuclei. These nuclei are subsequently stained with Hoechst dye and sorted through FACS to select for positively stained nuclei. FACS gating graphs based on Hoechst staining intensity show a clear separation between intact nuclei and debris, ensuring the quality of subsequent snRNA-seq analyses. The selected nuclei are then used to build an snRNA library to conduct next-generation sequencing. b, Anatomical illustration of an adult C. elegans, detailing major tissues. c,d, UMAP plot visualization of 241,969 single nuclei from adult C. elegans cell atlas. Colored clusters correspond to 15 major tissues and ARSC. The numbers in parentheses are the numbers of nuclei in each tissue. DTC, distal tip cells. Tissues marked with * can be further subclustered. Seventy-seven subsets of neurons are shown in d and others in Extended Data Fig. 1.

