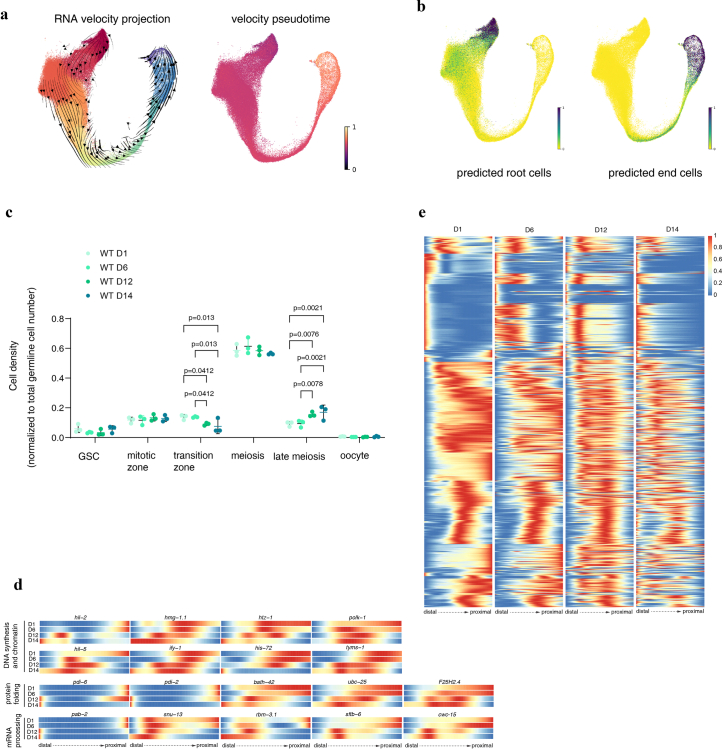
Extended Data Fig. 4. Germline trajectory mapping to identify age-related changes.
a, Velocity projection graph in UMAP embedding and Velocity pseudotime. b, UMAP graph highlighting predicted root and endpoints that correlated with germline stem cells and oocytes, respectively. c, Strip chart showing the percentage of germ nuclei in different regions of the germline at different ages. * P <0.05, one-way ANOVA test with Benjamini–Hochberg correction. n = 3 biologically independent samples for each time point. Data are presented as mean values +/− SD. d, Heatmaps showing that gene expression temporal patterns along the developmental progression of germ cells are disrupted with aging. e, Heatmaps showing gene expression levels along the distal-proximal axis of the germline. Genes related to DNA synthesis, chromatin assembly, protein folding and degradation, and mRNA processing show age-related decrease in the proximal end of the germline.

