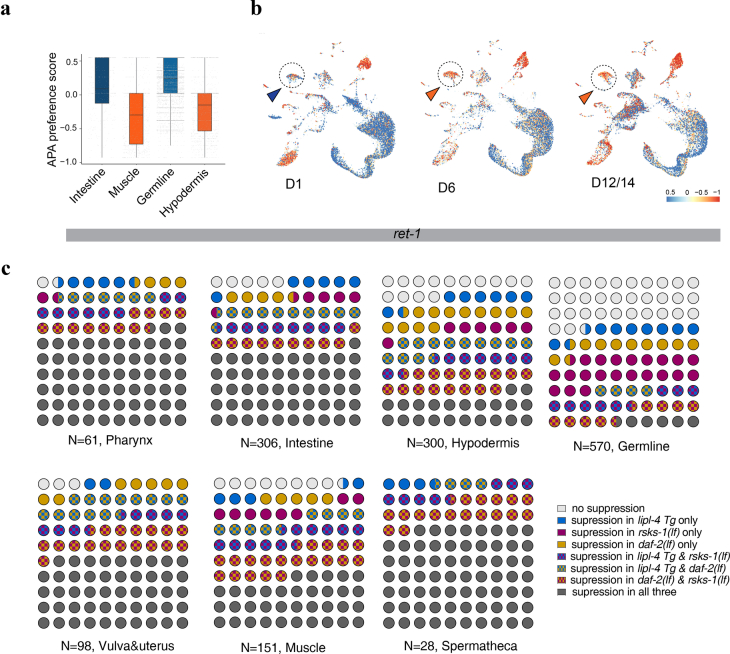
Extended Data Fig. 7. Effects of different pro-longevity strategies on age-related APA changes.
a, The APA preference of ret-1 across four tissues. The boxplot’s box spans the interquartile range (IQR), with the bottom and top representing the 25th and 75th percentiles, respectively, and the mean value at the middle in this case. Whiskers extend to the smallest and largest values within 1.5 times the IQR from the quartiles. b, UMAPs showing APA site preference of ret-1 among all cell types at different ages. Age-related APA changes in the intestine cluster (circle) are highlighted with arrowheads (red for proximal; blue for distal). c, Waffle plots showing how age-related APA changes are affected by different pro-longevity mechanisms in different tissues.

