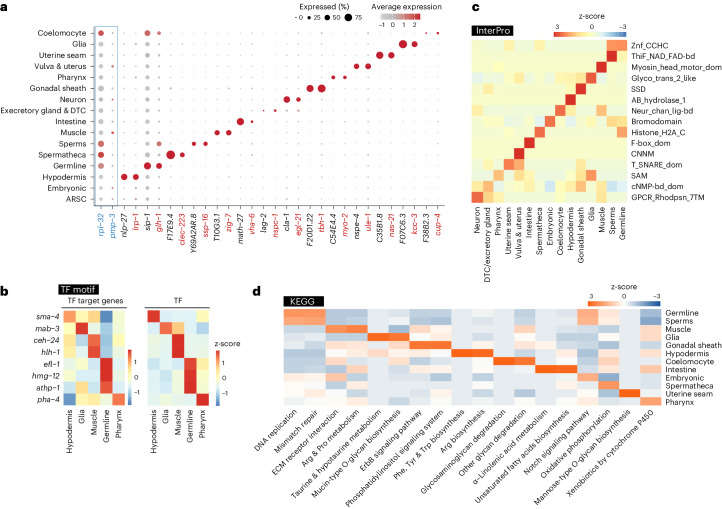
Fig. 2. Systemic view of cell-type-specific transcriptional and functional landscape.
a, Dot plot visualizing the cell-type-specific expression pattern of housekeeping genes (blue) and known (red) and newly identified (black) gene markers for each major tissue. Housekeeping genes rpl-32 and pmp-3 show pan-cell expression. Dot size corresponds to the percentage of cells within a specific tissue expressing the marker gene, and the color intensity indicates the average expression level of the gene across the tissue. b, Heatmaps showing the expression levels of the tissue-specific TFs (right) with the corresponding enrichment scores of their target genes (left) in each tissue. c,d, Heatmaps of tissue-specific functional modalities selected based on the enrichment scores using InterPro (c) and KEGG (d) pathway analyses. cNMP-bd_dom, cyclic nucleotide-binding domain; CNNM, cyclic nucleotide-binding domain; F-box_dom, F-box domain; Histone_H2A_C, histone H2A, C-terminal domain; Neur_chan_lig-bd, neurotransmitter-gated ion-channel ligand-binding domain; SAM, sterile alpha motif domain; SSD, sterol-sensing domain; T_SNARE_dom, target SNARE coiled-coil homology domain; ThiF_NAD_FAD-bd, THIF-type NAD/FAD binding fold; Znf_CCHC, zinc finger, CCHC type.

