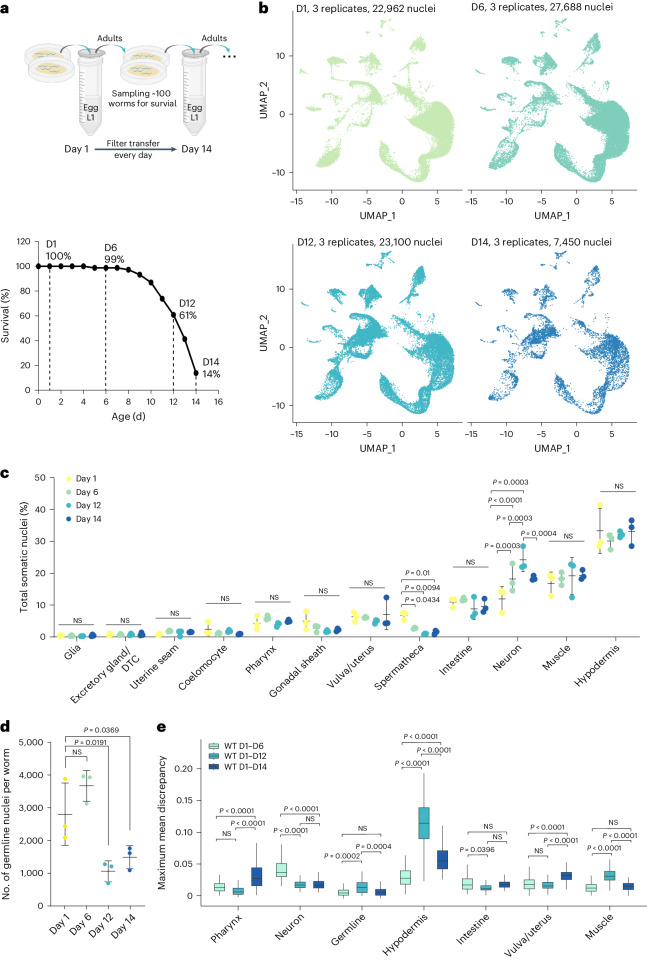
Fig. 3. Aging cell atlas under physiological conditions.
a, Schematic of aging sample preparation under physiological conditions without interrupting worm reproduction and the survival curve of worm samples used for nuclei collection at four timepoints to build the aging cell atlas. b, Cell atlases from four age groups shown by UMAP, three replicates per age group with total nuclei numbers. c, The percentage of various somatic cell types in total captured cells does not change much between four ages, except for spermatheca and neurons. Not significant (NS) P > 0.05. P values by one-way ANOVA test with Benjamini–Hochberg correction. n = 3 biologically independent samples for each timepoint. Data are presented as mean ± s.d. d, Numbers of germ nuclei decreased from day 1 and day 6 to day 12 and day 14. NS P > 0.05. P values by one-way ANOVA test with Benjamini–Hochberg correction. n = 3 biologically independent samples for each timepoint. Data are presented as mean ± s.d. e, Box plots displaying maximum mean discrepancy between age groups across different tissues in WT worms. NS P > 0.05. P values by one-way ANOVA test with Benjamini–Hochberg correction. n = 300 independent iterations. The box plot’s box spans the interquartile range (IQR), with the bottom and top representing the 25th and 75th percentiles, respectively, and the median value at the middle. Whiskers extend to the smallest and largest values within 1.5 times the IQR from the quartiles. D, day.

