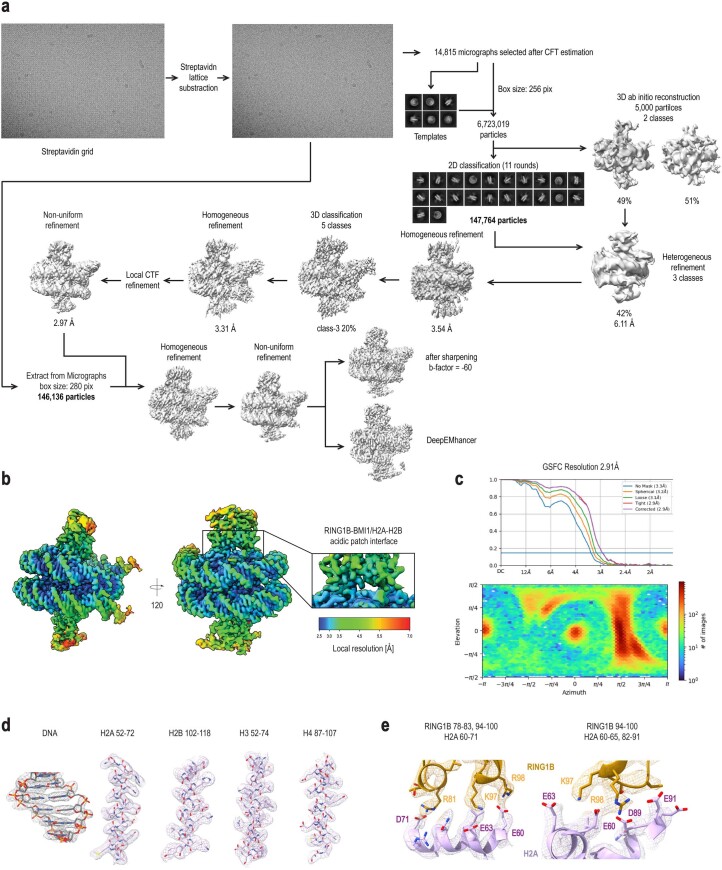
Extended Data Fig. 1. CryoEM analysis of vPRC1:Nuc.
(a) CryoEM processing scheme, also described in Methods. (b) Local resolution estimation of the final deepEMhancer map is shown in two different orientations, related by a 120˚ rotation around a vertical axis. A zoom-in on the RING1B-BMI1/H2A-H2B acidic patch interference is displayed, with colors ranging from blue (high resolution) to red (low resolution). (c) Corresponding gold-standard Fourier shell correlation (GSFSC), as well as angular distribution plot obtained from CryoSPARC (color indicative of the number of particles, increasing from blue to red, in a defined orientation). (d) Representative regions of the DeepEMhancer density map for the nucleosome components (histones and DNA). DNA is in gray while histones are in pink. (e) Representative regions of the DeepEMhancer density map for the interfaces involving RING1B interaction with the H2A acidic patch. H2A histone in pink while RING1B in gold.

