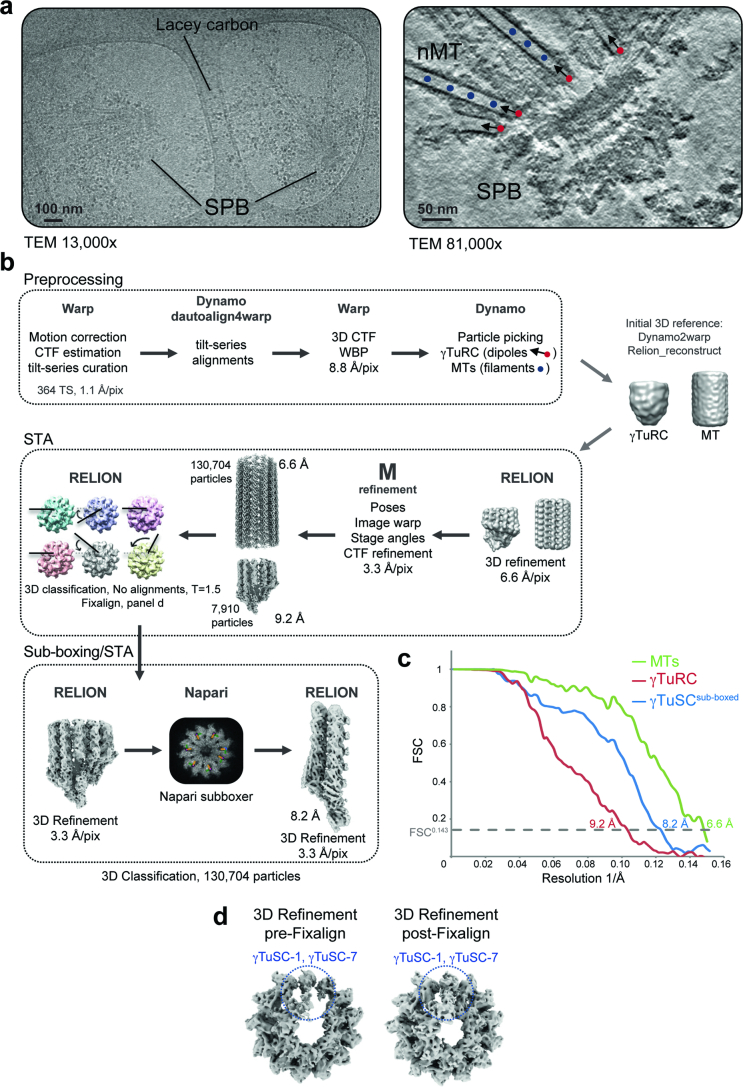
Extended Data Fig. 1. Cryo-ET data processing scheme.
a, (left) Representative electron micrograph at 13,000x magnification of the enriched SPB sample on lacey grids. Similar SPB structures were observed in more than 500 independent tomograms. (right) Slice through a tomogram with red circles indicating centre of the dipole geometry used to pick γTuRCs, the arrows define the z-axis. Blue circles indicate positions along which microtubules were picked as a filament, the z-axis is pointed away from the SPB. Representative of more than 500 tomograms. b, Custom data processing pipeline, also outlined in the Methods section. Tilt-series (TS) were preprocessed in Warp and aligned using dautoalign4warp (Dynamo). Bin8 tomograms were generated in Warp and particle picking was performed in Dynamo, with γTuRC picked as dipoles and MTs picked as filaments. Sub-tomogram volumes were extracted in Warp and refined using RELION. Both γTuRC and MT particles were co-refined in M to give a final consensus refinement map. To identify and correct particle misalignments, a manual procedure (the Fixalign procedure) was developed: γTuRC particles were classified without alignment to identify classes where the seam of the γTuRC 3D class (full black line) was misaligned with respect to the seam of the initial γTuRC reference (dotted line). Misalignment was corrected by manually realigning 3D class averages in ChimeraX and applying the corresponding transformations to the respective particle stacks of the misaligned 3D class averages (arrow from full black line to dotted line). The Fixalign procedure improved density of γTuSCs-1 and γTuSCs-7 substantially (see also panel d). Next, A custom-built Napari sub-boxer plugin was used to sub-box and mask γTuRC particles into individual γTuSCs with two rows of α/β-tubulin to expand the dataset and improve the resolution. Sub-boxed γTuSCs were subjected to 3D refinement in RELION 3.1. WBP: weighted back projection. c, Fourier-shell correlation (FSC) curves for the reconstructions used in this study. d, Bottom view of the γTuRC before and after manually correcting misalignment of the γTuRC helical register (Fixalign). Prior to manual realignment the density for γTuSC-1 and γTuSC-7 was diffuse, but improved substantially after realignment and further 3D refinements.

