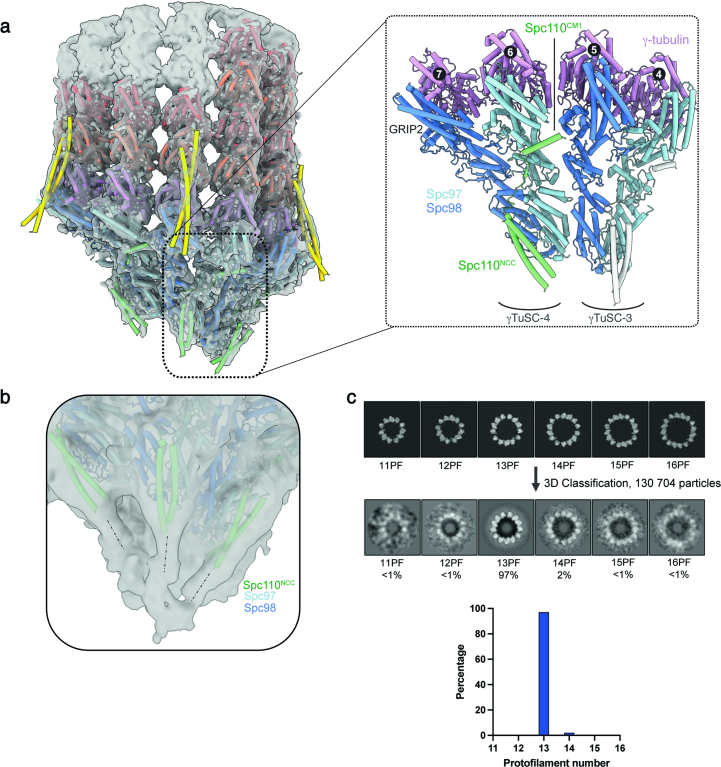
Extended Data Fig. 3. Details of Spc110 and coiled-coil interactions with the γTuRC.
a, Consensus cryo-ET map of the γTuRC with a fitted molecular model of the γTuRC shows that the secondary structure and path of Spc110NCC and Spc110CM1 are resolved and in agreement with previous reconstituted structures18. b, At lower threshold the sub-tomogram average shows that Spc110NCC densities continue downwards until they converge on a single large stalk density. The map was blurred with a B-factor of 400 for visualization purposes. c, 3D classification of MTs was used to separate MT species according to protofilament numbers, following the MiRP procedure68. Representative slices through reference volumes used during 3D classification of the microtubule sub-tomogram volumes. 97% of spindle microtubules contain 13 protofilaments.

