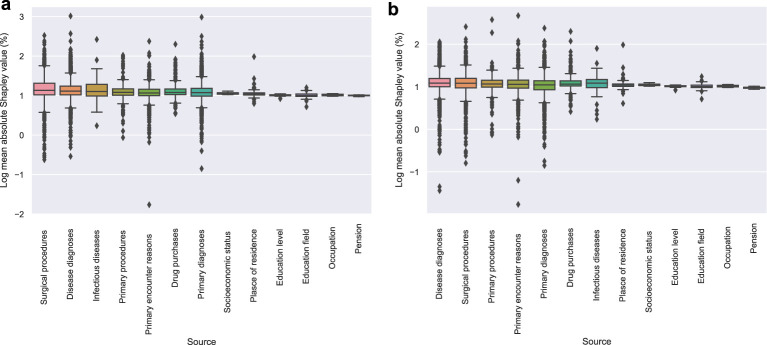
Extended Data Fig. 4. Predictor importance using Shapley values, box-and-whisker plots.
a, Box-and-whisker plot for mean absolute Shapley values as a percentage change from the baseline by feature category. b, Mean absolute Shapley values excluding file last years before the predictive period. The center line of each box indicates the median, the bounds of the box represent the interquartile range (IQR, 25th to 75th percentiles), and the whiskers extend to the minima and maxima values within 1.5 times the IQR from the quartiles. Points outside this range are considered outliers and are shown as individual points

