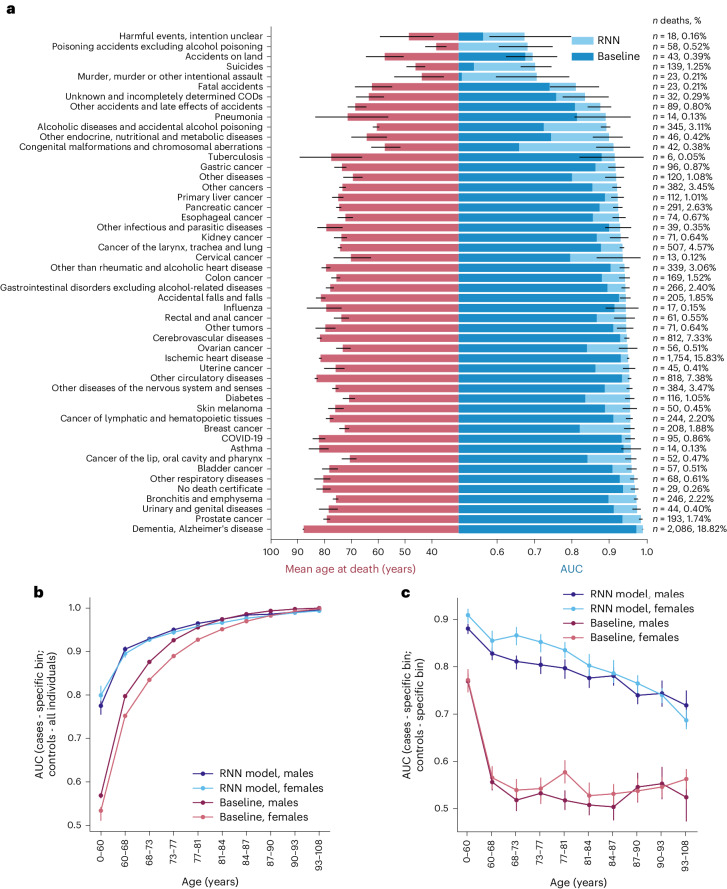
Fig. 4. Mortality prediction for the cause-of-death, age and sex subgroups.
a, Left, Average age at time of death from a specific cause within a testing set. Right, AUC values for individuals dying from a specific cause. AUCs are reported separately for the RNN and baseline models. CIs obtained via bootstrapping are reported only for the RNN model to improve readability. The number and percentage of people dying from a specific cause is given in the right margin of a panel. Only CODs with five or more cases were considered. b, Model AUC scores for specific age and sex subgroups of cases (group identification approach: considering cases from a specific age and sex subgroup versus all controls). c, Model AUC within specific age and sex subgroups (group differentiation approach: considering cases and controls from a specific subgroup only). This corresponds to evaluating the predictive performances of the model after the effect of age as a predictor has been substantially minimized (for more precise removal of the age effect, see Extended Data Fig. 1c). Within the ten age bins in b,c, an equal number of cases was ensured. The 95% CIs were estimated using 1,000 bootstrap resamples, determining the 2.5th and 97.5th percentiles of the resulting AUC distribution.

