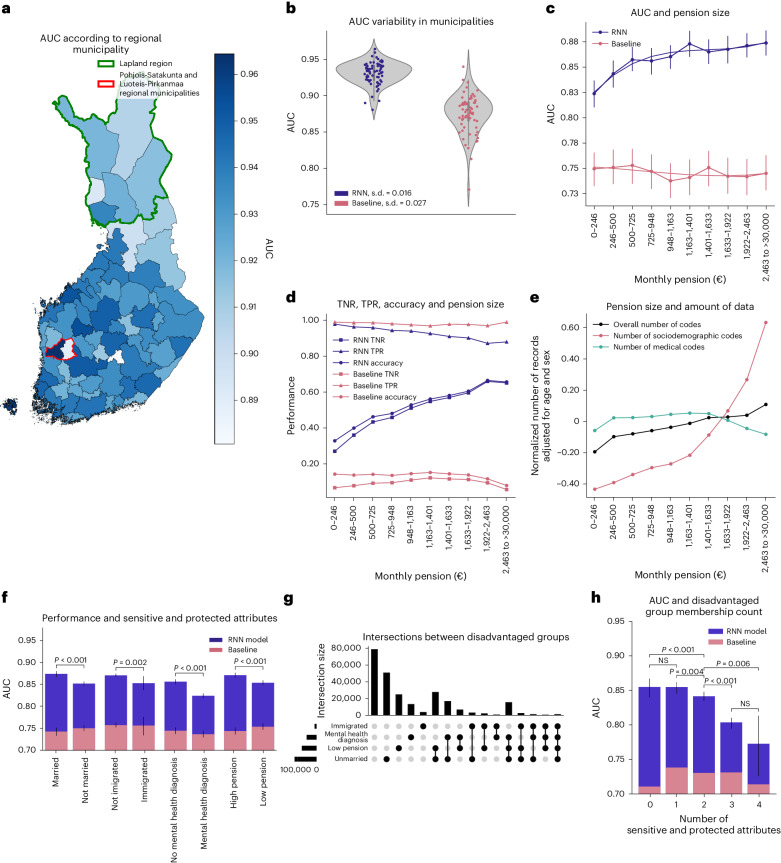
Fig. 5. Fairness regarding place of residence, pension size and other sensitive attributes.
a, AUC variation according to regional municipality in Finland. The green border marks the Lapland region in which the AUC was significantly lower than in the rest of Finland, while the red border surrounds two neighboring regional municipalities with significantly different AUCs. b, Each dot represents a different regional municipality. Variability in prediction performance in different regional municipalities showed a larger spread and greater geographical variability for baseline compared to the RNN model. c, AUC from the baseline and RNN models within each pension level bin. The RNN model had higher prediction performances among individuals with a higher pension. d, Accuracy, TPR and TNR for the RNN and baseline models as a function of pension. The classification metrics were calculated based on a probability cutoff of 0.0089 for the RNN model and 0.0094 for the baseline model (see Methods for the cutoff calculation). For an RNN model, an increase in AUC with greater pension size was driven by TNR—better identification of individuals who did not die during a predictive interval. e, The average number of total records available for training the RNN model as a function of pension size. The average number of total records per individual was adjusted for age and sex and then normalized. This metric allows the evaluation of whether individuals with a higher pension have more information available, potentially explaining the better performance of the RNN models. Records from three main data categories are reported. In c–e, ten pension bins were used, ensuring an equal number of cases in each. f, AUCs for different attributes considered protected or sensitive: marital status, immigration status, mental health diagnosis and pension size (individuals were split into two pension size groups, thus assuring an equal number of cases in each). g, UpSet plot36 visualizing the intersections between four groups of disadvantaged individuals. h, AUC for the RNN and baseline models in individuals having none, one or several disadvantages across four sensitive and protected attributes simultaneously. The 95% CIs were estimated using 1,000 bootstrap resamples, determining the 2.5th and 97.5th percentiles of the resulting AUC distribution. The P value for the difference in AUCs was determined using permutation testing.

