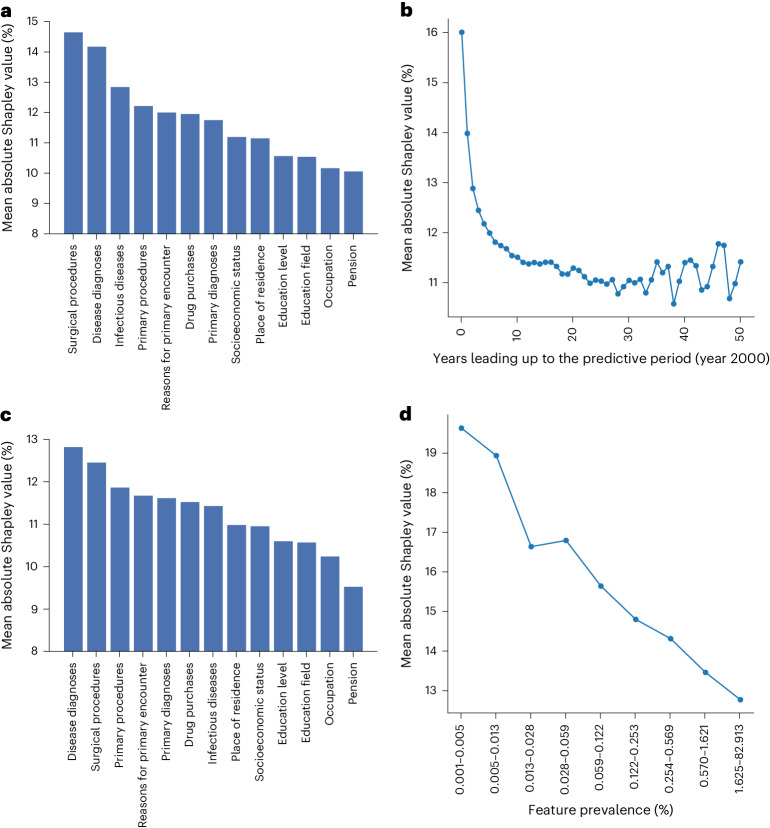
Fig. 6. Feature importance using Shapley values.
a, Mean absolute Shapley values within each feature category. b, Mean absolute Shapley values within each year leading up to the predictive period (year 2020). c, Mean absolute Shapley values within each feature category excluding all feature codes reported in the last 5 years before the predictive period. d, Mean Shapley values across features classified within different prevalence bins. For bar-and-whisker plots, see Extended Data Fig. 4.

