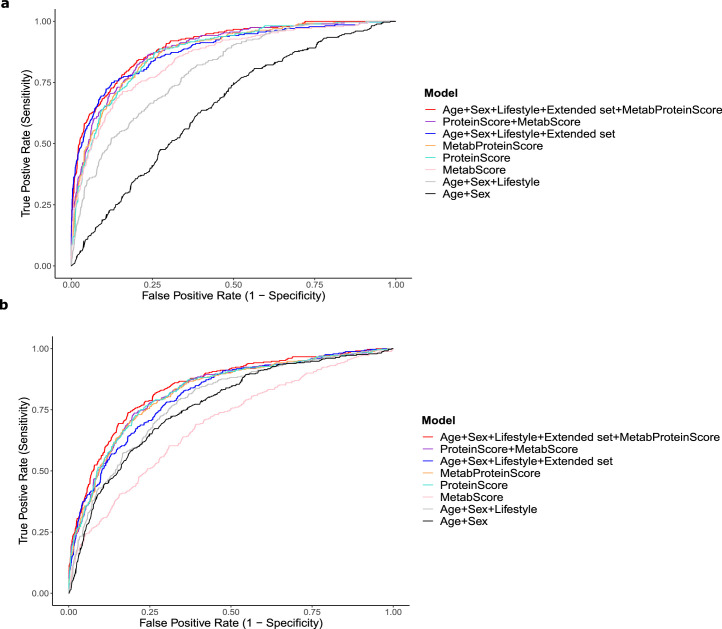
Extended Data Fig. 7. Comparison of metabolomic and proteomic feature performance for type 2 diabetes and all-cause mortality traits.
ROC curves for 10-year onset scores developed in the subsets of the training and test populations that had metabolomics and proteomics available. A Metabolomic score (MetaboScore), ProteinScore and a joint omics score (MetaboProteinScore) are modelled individually and concurrently and benchmarked against either age and sex, six lifestyle factors, or an ‘extended set’ including these variables in addition to a further 18 clinically relevant covariates. a, ROC curve comparison for type 2 diabetes. b, ROC curve comparison for all-cause mortality. Full summary statistics are available in Supplementary Table 16.

