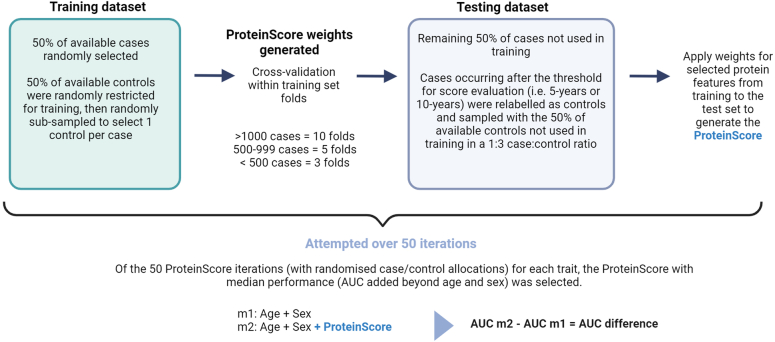
Extended Data Fig. 8. Summary of the ProteinScore development pipeline.
ProteinScores were developed across fifty randomised iterations. For each iteration, 50% of available cases were randomly allocated to the training set and 50% of controls were randomly sampled to obtain a 1:3 case:control ratio. Cox PH elastic net regression with cross-fold validation across folds of the training sample was used to derive weighting coefficients. The 50% of cases that were not included in the training set were allocated to the test set. If cases in the test set occurred after the threshold for onset evaluation (that is 5-year or 10-year), they were relabelled as controls and randomly sampled with the 50% of controls not considered during training, to obtain a 1:3 case:control ratio. Of the fifty ProteinScore iterations tested, the ProteinScore that yielded the median incremental difference to the Area Under the Curve (AUC) beyond a minimally-adjusted model was identified. If no features were selected for an iteration, it was weighted with a performance of 0 in median AUC selection. If features were selected for an iteration but the randomly sampled test set included no cases at or beyond the onset threshold (precluding extraction of baseline hazard at this point for AUC calculation) these models were excluded from the median ProteinScore selection. Created with BioRender.com.

