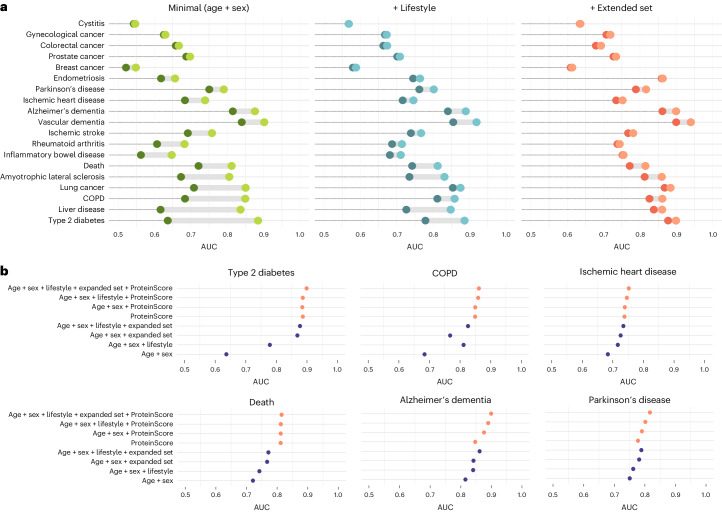
Fig. 2. Value offered by ProteinScores for incident outcomes in the UK Biobank.
a, Differences in AUC resulting from the addition of the 19 ProteinScores to models with increasingly extensive sets of covariates: minimally adjusted (age and sex in which traits were not sex-stratified) in green, minimally adjusted with the addition of a core set of six lifestyle covariates in blue, and further adjustment for an extended set of 18 covariates that are measured in clinical settings (physical and biochemical measures) in orange. AUC plots are ordered by increasing AUC differences in the minimally adjusted models. All ProteinScore performance statistics shown correspond to 10-year onset, except those for amyotrophic lateral sclerosis, endometriosis and cystitis, which were assessed for 5-year onset. Darker-shaded points indicate the base covariate model used, whereas lighter-shaded points connected by gray shading indicate the difference added by the addition of the ProteinScore into the model. b, A breakdown of the AUC values achieved by different combinations of risk factors with and without the ProteinScores is shown for the six incident outcomes whereby the ProteinScore contributed statistically significantly beyond a Cox PH model including all 24 minimal, lifestyle and extended set variables (ROC P < 0.0026, the Bonferroni-adjusted threshold). All six of the best-performing ProteinScores shown were assessed for the 10-year onset of the disease. Results that include the ProteinScore are shaded in orange, whereas results that do not are shaded in purple. Two-sided tests were used in all cases.

