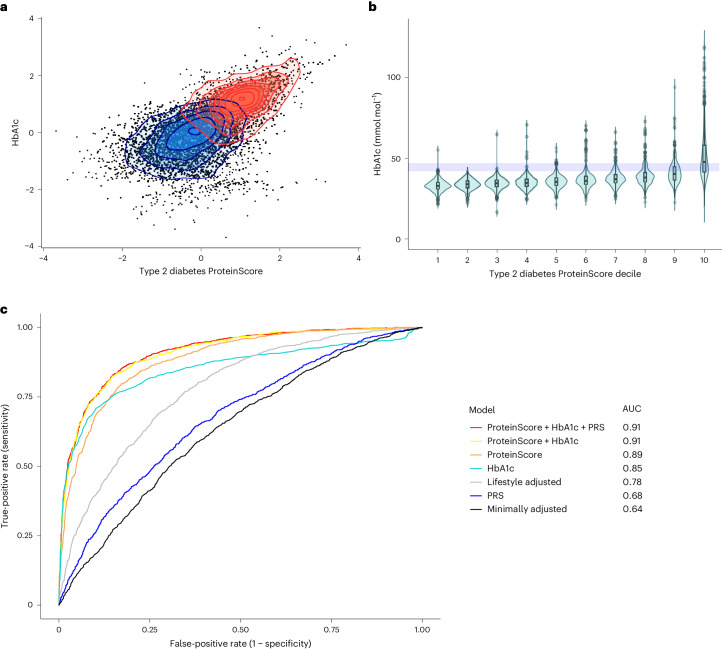
Fig. 3. Exploration of the type 2 diabetes ProteinScore.
a, Case (red) and control (blue) discrimination for HbA1c and the type 2 diabetes ProteinScore in the test set (1,105 cases and 3,264 controls, mean time to case onset 5.4 years (s.d. 3.0 years)). Both markers were rank-based inverse normalized and scaled to have a mean of 0 and s.d. of 1. b, HbA1c (mmol mol−1) per decile of the type 2 diabetes ProteinScore in the test set (1,105 cases and 3,264 controls, mean time to case onset 5.4 years (s.d. 3.0 years)). The shaded rectangle indicates the type 2 diabetes HbA1c screening threshold (42–47 mmol mol−1). Violin plots display the median and upper and lower quartiles as the three lines comprising the central rectangle, with minima and maxima points corresponding to those at the tips of the plot whiskers. c, ROC curves for incremental 10-year-onset models incorporating HbA1c, the type 2 diabetes ProteinScore and a PRS for type 2 diabetes individually and concurrently.

