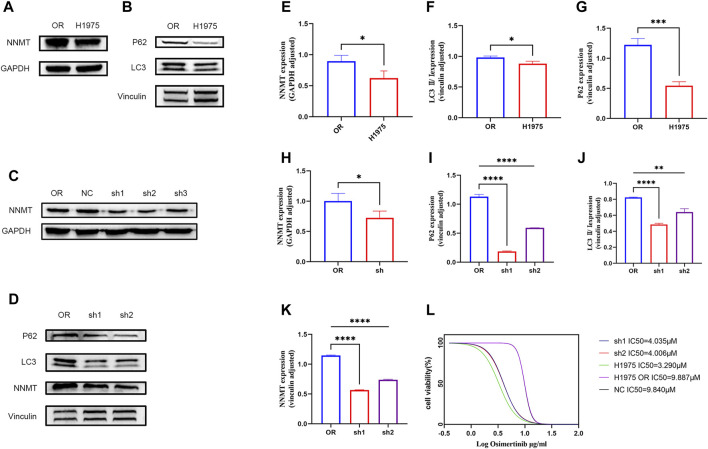
FIGURE 4.
(A,B) Differences in the expression of NNMT and autophagy between H1975 and H1975OR cells. (C) Construction of NNMT knockdown stable-turnover cells. (D) Differences in the expression of NNMT and autophagy between H1975OR, sh1 and sh2. (E–K) Statistical analysis of protein expression differences (p-value <0.05). Quantitation of these results, with comparison using an unpaired two-tailed t-test. (L) The IC50 value of H1975, H1975OR, NC, sh1, sh2. *(p < 0.05), **(p < 0.01), ***(p < 0.001), and ****(p < 0.0001).

