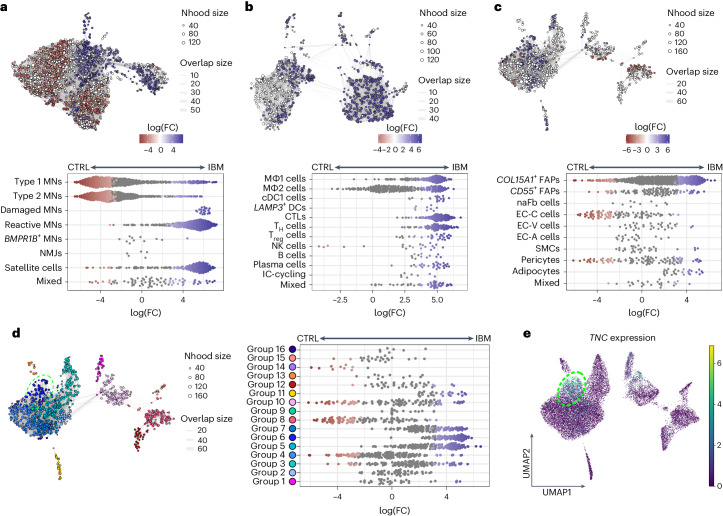
Fig. 3. Differential abundance analysis between CTRLs and IBM.
a, Top, neighborhood graph visualizing the results of differential abundance analysis between CTRL and IBM MNs. Bottom, beeswarm plot showing the log(fold change) (log(FC)) of abundance in neighborhoods between CTRL and IBM MNs. b, Top, neighborhood graph visualizing the results of differential abundance analysis between CTRLs and IBM in immune cells. Bottom, beeswarm plot showing the log(FC) of abundance in neighborhoods between CTRLs and IBM in immune cells. c, Top, neighborhood graph visualizing the results of differential abundance analysis between CTRLs and IBM in endothelial–stromal cells. Bottom, beeswarm plot showing the log(FC) of abundance in neighborhoods between CTRLs and IBM in endothelial–stromal cells. d, Left, neighborhood plot showing the grouping of neighborhoods as shown in c based on the number of shared cells and direction of fold-changes of abundance between CTRLs and IBM in endothelial–stromal cells. Right, beeswarm plot showing log(FC) of abundances of neighborhoods within neighborhood groups in endothelial–stromal cells. e, UMAP visualization showing TNC expression within endothelial–stromal cell subpopulations in CTRL, IMNM and IBM muscle. Note, contours in d and e highlight neighborhoods/cells of group 6. For neighborhood graphs in a–d: every node represents a neighborhood, colored by log(FC) between CTRLs (red) and IBM (blue). Neighborhoods with no detected differential abundance (corrected spatial FDR > 0.1) are colored white (a–c). The node size correlates with the number of nuclei within a neighborhood (Nhood size) and the graph edge width indicates the number of overlapping cells between adjacent neighborhoods (overlap size). The position of nodes is based on the position of the nuclei shown in the UMAP visualizations in Fig. 2a,d,g. For beeswarm plots in a–d: every dot represents a neighborhood, colored by log(FC) between CTRLs (red) and IBM (blue). Neighborhoods with no detected differential abundance (corrected spatial FDR > 0.1) are colored gray. Note, ‘mixed’ indicates that <70% of nuclei within a neighborhood originate from one single cluster.

