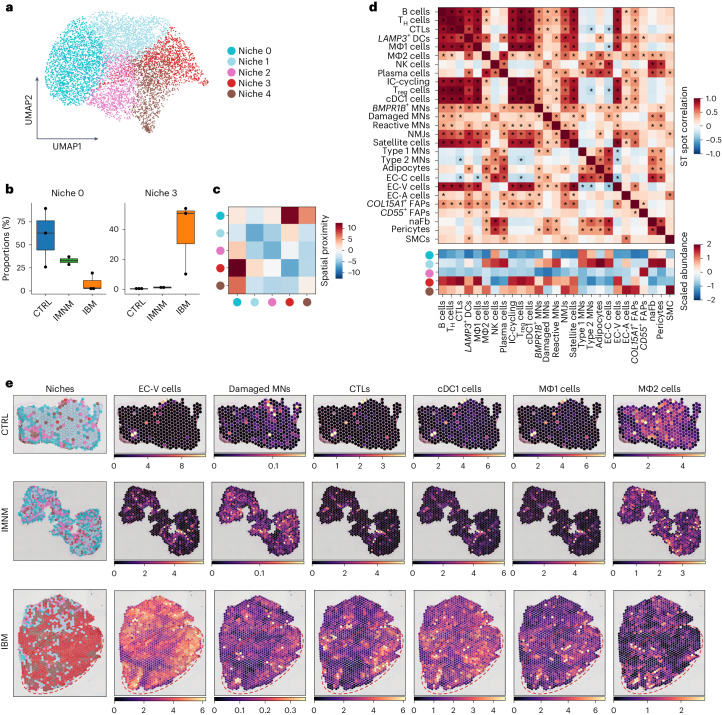
Fig. 4. ST reveals IBM-specific inflammatory tissue niche.
a, UMAP visualization showing tissue niches of CTRL, IMNM and IBM muscle (spots, n = 7,462). b, Compositional analysis of tissue niches in CTRLs, IMNM and IBM (CTRLs, n = 3; IMNM, n = 2; IBM, n = 3) showing reduced proportions of myofiber-associated niche 0 in IBM compared with CTRLs and increased proportions of immune cell-associated niche 3 in IBM compared with CTRLs. Box plots show median and IQR of tissue niche proportions, with whiskers extending to the largest and smallest values within the 1.5× IQR. c, Heatmap showing spatial proximity of tissue niches. d, Heatmaps showing the correlation of spatial locations of cell types identified by snRNA-seq (upper heatmap) and scaled abundance of these cell types within tissue niches. |r|: *P > 0.25. e, Tissue niches shown on tissue sections of CTRL, IMNM and IBM muscle in the left column. The right columns show locations of selected cell types identified in snRNA-seq based on deconvolution of ST data (CTRL, n = 3; IMNM, n = 2; IBM, n = 3). Note, the red contours highlight areas with a low abundance of type II MNs in IBM (Fig. 1f).

