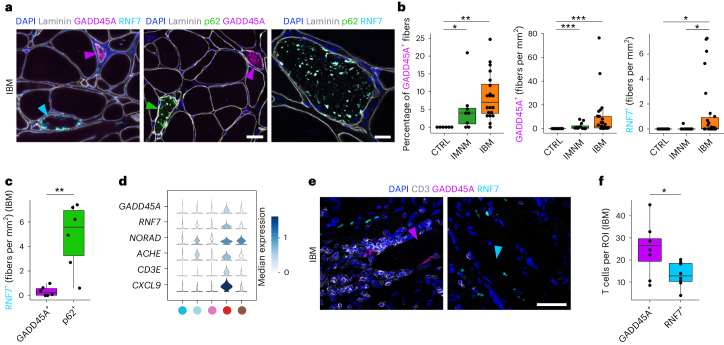
Fig. 5. GADD45A-associated myofiber infiltration of T cells in IBM.
a, IHC for laminin, p62, GADD45A and RNF7 in IBM. Note the protein aggregates containing p62 and RNF7 in a myofiber in the right image, and purple arrowheads pointing at GADD45A+ myofibers, a cyan arrowhead at a RNF7+ myofiber and a green arrowhead at a p62+ myofiber. Scale bar, 50 μm (left and middle image), 20 μm (right image). b, Box plots showing quantification of GADD45A+ myofibers and RNF7+ myofibers in CTRLs, IMNM and IBM (left plot: CTRLs, n = 6; IMNM, n = 8; IBM, n = 20, P(CTRL-IBM) = 1.5 × 10⁻³, P(CTRL-IMNM) = 1.9 × 10⁻²; middle plot: CTRLs, n = 12; IMNM, n = 12; IBM, n = 28, p(CTRL-IBM) = 3.7 × 10⁻⁶, P(CTRL-IMNM) = 1.9 × 10⁻⁴; right plot: CTRLs, n = 11; IMNM, n = 12; IBM, n = 26, P(CTRL-IBM) = 1.7 × 10⁻², P(IMNM-IBM) = 2.3 × 10⁻²). c, Box plot showing quantification of RNF7+ myofibers coexpressing GADD45A or p62 in IBM (n = 6, P = 9.1 × 10⁻³). d, Stacked violin plots showing expression of the damaged MN markers GADD45A, RNF7 and NORAD and ACHE and inflammation markers CD3E and CXCL9 within tissue niches. e, IHC for GADD45A+ and RNF7+ myofibers to CD3+ T cells in IBM muscle with T cells invading a GADD45A+ myofiber. A purple arrowhead points at a GADD45A+ myofiber and a cyan arrowhead at a RNF7+ myofiber. Scale bar, 50 μm. f, Box plot showing the amount of CD3+ T cells around GADD45A+ or RNF7+ myofibers per region of interest (ROI) per IBM sample (n = 8, P = 2.2 × 10⁻²). Box plots in b, c and f show the median and IQR, with whiskers extending to the largest and smallest values within the 1.5× IQR range. Two-tailed, pairwise Wilcoxon’s rank-sum tests with Benjamini–Hochberg correction to account for multiple comparisons were performed between conditions in b. Two-tailed, paired Student’s t-tests were performed between groups in c and f. *P < 0.05, **P < 0.01, ***P < 0.001.

