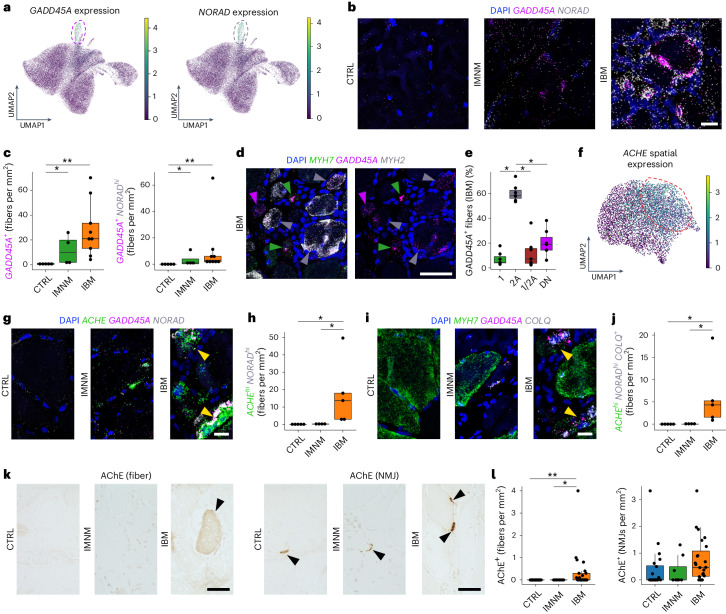
Fig. 6. Elevated ACHE expression in IBM is associated with lncRNA NORAD upregulation.
a, UMAP visualization showing GADD45A and NORAD expression within MNs in CTRLs, IMNM and IBM. b, SmFISH for GADD45A and NORAD in CTRLs, IMNM and IBM. c, Quantification of GADD45A+ (P(CTRL-IBM) = 3.0 × 10⁻³, P(CTRL-IMNM) = 2.4 × 10⁻²) and GADD45A+ NORADhi myofibers (P(CTRL-IBM) = 9.0 × 10⁻³, P(CTRL-IMNM) = 2.3 × 10⁻²) based on smFISH in CTRLs (n = 5), IMNM (n = 4) and IBM (n = 9). d, SmFISH for GADD45A and MYH7 (type 1) and MYH2 (type 2 A) in IBM. The arrowheads indicate GADD45A+ type 1 (green), GADD45A+ type 2A (gray) and MYH7−MYH2−GADD45A+ (purple) myofibers. e, Proportions of GADD45A expression in different myofiber types in IBM (n = 7) (P(2A-1) = 3.1 × 10⁻², P(2A-1/2 A) = 3.1 × 10⁻², P(2A-DN) = 3.1 × 10⁻²). f, UMAP visualization showing spatial ACHE expression in CTRLs, IMNM and IBM. g, SmFISH showing expression of GADD45A, NORAD and ACHE in CTRLs, IMNM and IBM. The yellow arrowheads point at ACHEhiNORADhi myofibers. h, Quantification of ACHEhiNORADhi myofibers in CTRLs (n = 5), IMNM (n = 4) and IBM (n = 5) (P(CTRL-IBM) = 2.4 × 10⁻², P(IMNM-IBM) = 2.4 × 10⁻²). i, SmFISH for GADD45A, MYH7 and COLQ in CTRLs, IMNM and IBMs. The yellow arrowheads indicate COLQ+ myofibers, coexpressing ACHE and NORAD (see g). j, ACHEhiNORADhiCOLQ+ myofiber quantification in CTRLs (n = 5), IMNM (n = 4) and IBM muscles (n = 5) (P(CTRL-IBM) = 2.2 × 10⁻², P(IMNM-IBM) = 2.7 × 10⁻²). k, IHC for AChE+ myofibers and NMJs in IBMs. The black arrowheads point at AChE+ myofibers (left) and NMJs (right), respectively. Scale bar, 50 μm. l, Quantification of AChE+ myofibers and NMJs in CTRLs (n = 20), IMNM (n = 8) and IBM (n = 23) (left: P(CTRL-IBM) = 2.1 × 10⁻³, P(IMNM-IBM) = 3.2 × 10⁻²; right: P(CTRL-IBM) = 7.6 × 10⁻²). Contours in a and f highlight areas with high expression of displayed genes. Box plots in c, e, h, j and l show the median and IQR, with whiskers extending to the largest and smallest values within 1.5× the IQR. Here, two-tailed, pairwise Wilcoxon’s rank-sum (c, h, j and l) or signed-rank (e) tests with Benjamini–Hochberg correction to account for multiple comparisons were performed. *P < 0.05, **P < 0.01. Scale bars, 20 µm (b, g and i), 50 µm (d and k).

