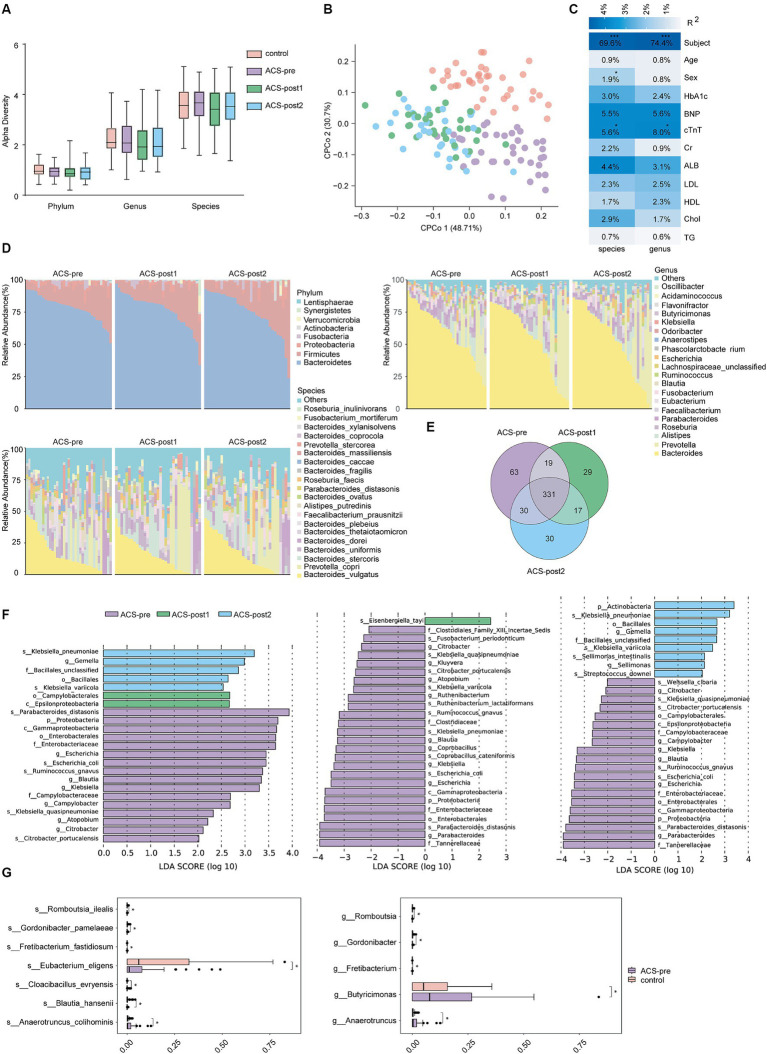
Figure 1.
Alterations in gut microbiota among the four groups. (A) α-diversity (Shannon index) among the four groups was analyzed at the phylum, genus and species levels. (B) Constrained Principal Coordinates Analysis (CPCoA) of Euclidean distance on all samples based on species level. PERMANOVA test was used to detect the independent effects of clinical features on microbial community (Euclidean distance). (C) Correlation of clinical indicators and gut microbiota. R-square statistics were presented on each cell. Clinical features included subject, age, sex, TG, triglycerides; Chol, cholesterol; HDL, high-density lipoprotein; LDL, low-density lipoprotein; ALB, albumin; Cr, Creatinine; cTnT, cardiac troponin T; BNP, B-type natriuretic peptides; HbA1c, hemoglobin A1c. (D) Relative abundance of gut microbiota on phylum, genus, and species levels in ACS patients at three time points. (E) Venn diagram on species level in individuals from various stages. (F) Biomarkers of ACS patients at different stages of treatment (LDA score threshold >2). (G) Differential species between healthy controls and ACS patients before treatment (*adjust p < 0.05, **adjust p < 0.01, and ***adjust p < 0.001, t-test, Benjamini–Hochberg FDR).

