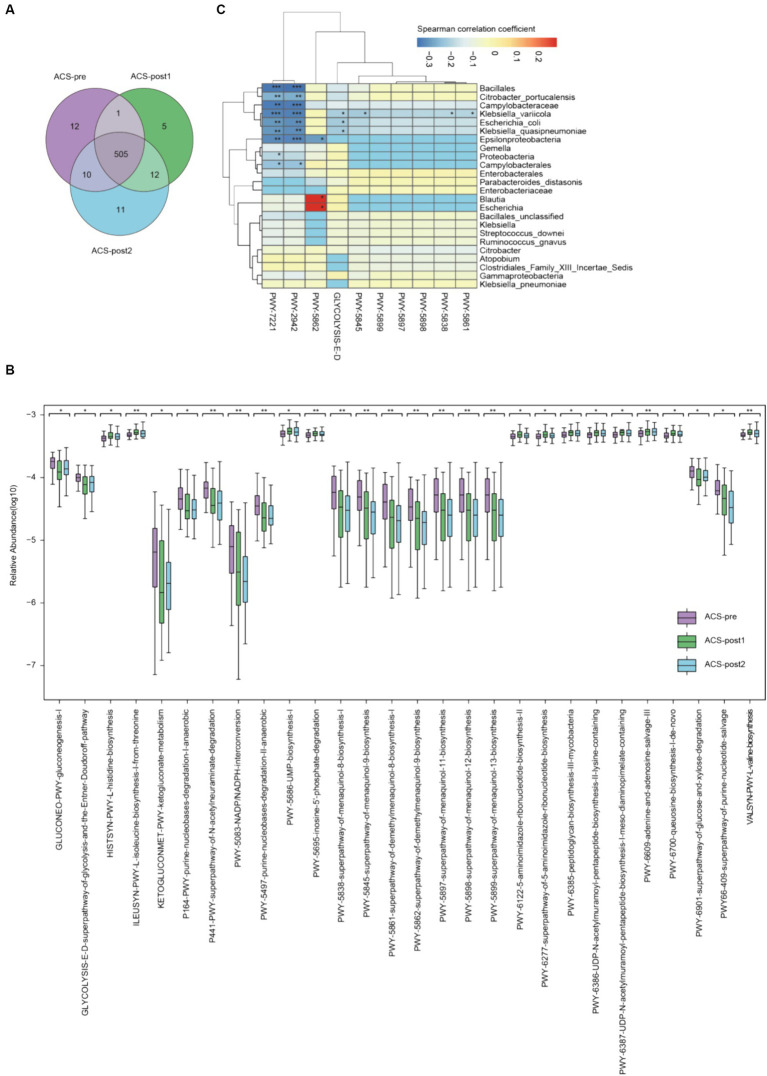
Figure 2.
Alterations of functional pathways in ACS patients before and after treatment. (A) Venn diagram of metabolic pathways in ACS samples from various stages. (B) Significantly differential pathways of ACS patients before and after treatment (*adjust p < 0.05, **adjust p < 0.01, and ***adjust p < 0.001, Kruskal–Wallis test, Benjamini–Hochberg FDR). (C) Association between microbiome composition and metabolic pathways. Correlation values (Spearman) were presented on each cell by various colors and significance also emerged (*p < 0.05, **p < 0.01, and ***p < 0.001, t-test).

