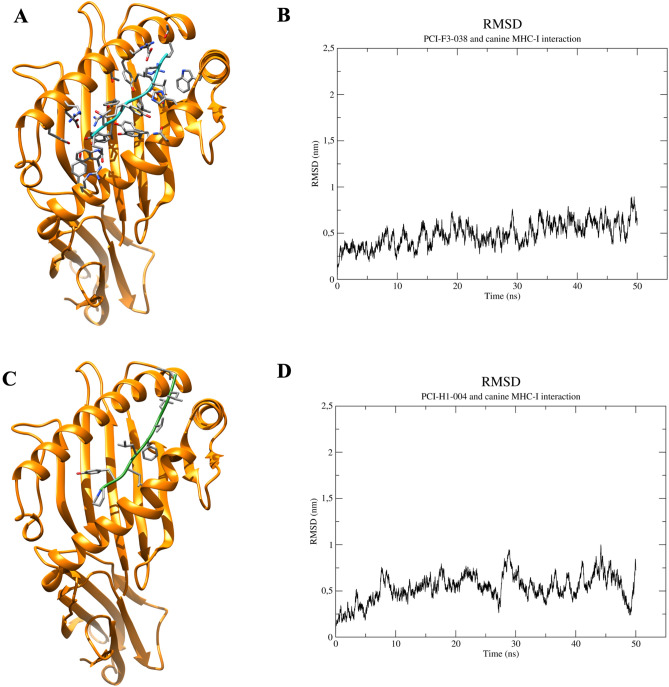
Figure 3.
Molecular docking and dynamics of the predicted peptides in complex with MHC molecules. (A) Molecular interaction between PCI-F3-038 and canine MHC-I molecules obtained with a molecular docking tool. (B) Root mean square deviation (RMSD) plot of the interaction interface between PCI-F3-053 and MHC class I. (C) Molecular interaction between PCI-H1-004 and canine MHC-I molecules obtained with a molecular docking tool. (D) RMSD deviation plot of the PCI-F3-004 and MHC class I interactions. Representative peptide–MHC complex molecules are shown. All 3D graphics were generated using the software UCSF Chimera. Graphs for molecular dynamics were obtained with Xmgrace software (Oregon Graduate Institute of Science and Technology, Hillsboro, OR, USA).

